
Welcome to Aftermarket Report, a newsletter where we do a quick daily wrap-up of what happened in the markets, both in India and globally.
What data points and transformations do you want to see?
We’re trying out a new format for the Aftermarket Report, with much more comprehensive coverage of the data that shapes the trading day.
Beyond the headline indices, we’re now tracking market breadth, new highs and lows, sector and thematic performance, delivery data, F&O positioning, global markets, commodities, flows, and more. We’re also looking at ways to transform this raw data into insights that are actually useful for traders and investors.
The idea is simple: bring different datasets together in one place to give you a clearer picture of what’s happening beneath the surface of the market.
This is still a work in progress, and we’d love your feedback. What data points are we missing? What transformations, ratios, comparisons, or indicators would you find useful? Also tell us what worked, what didn’t, and what felt unnecessary.
Your feedback will help shape the Aftermarket Report from here.
Markets Today
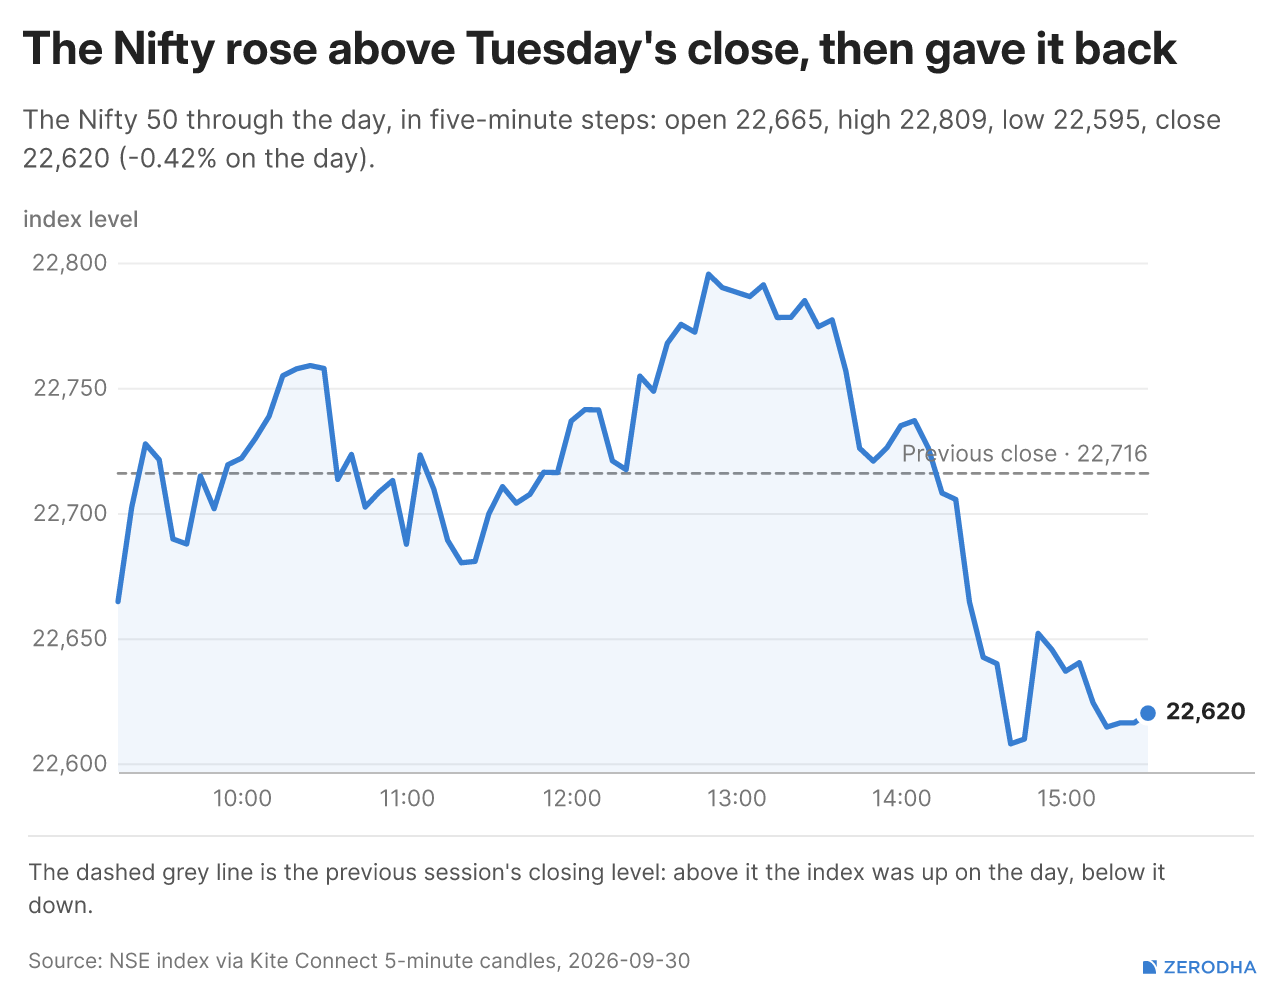
Nifty opened with a 51-point gap down at 22,665, tracking lacklustre global cues even as oil prices moderated slightly. The index remained volatile in the opening hour, initially recovering towards 22,760 before giving up gains and slipping back to 22,680 by 11:30 AM. The index then gradually moved to 22,750 till noon.
Momentum improved after noon, with Nifty climbing steadily and briefly testing 22,800 around 12:45 PM. However, the recovery failed to sustain, and the index reversed sharply after 1:30 PM, falling back towards 22,720. Selling intensified after 2 PM, dragging Nifty below 22,650 and eventually towards an intraday low near 22,595 around 2:40 PM. A modest recovery till 22,650 followed, but the recovery remained limited. Nifty eventually closed at 22,620.45, around 45 points below its opening level, ending another volatile session near the day’s lower levels.
Market Breadth
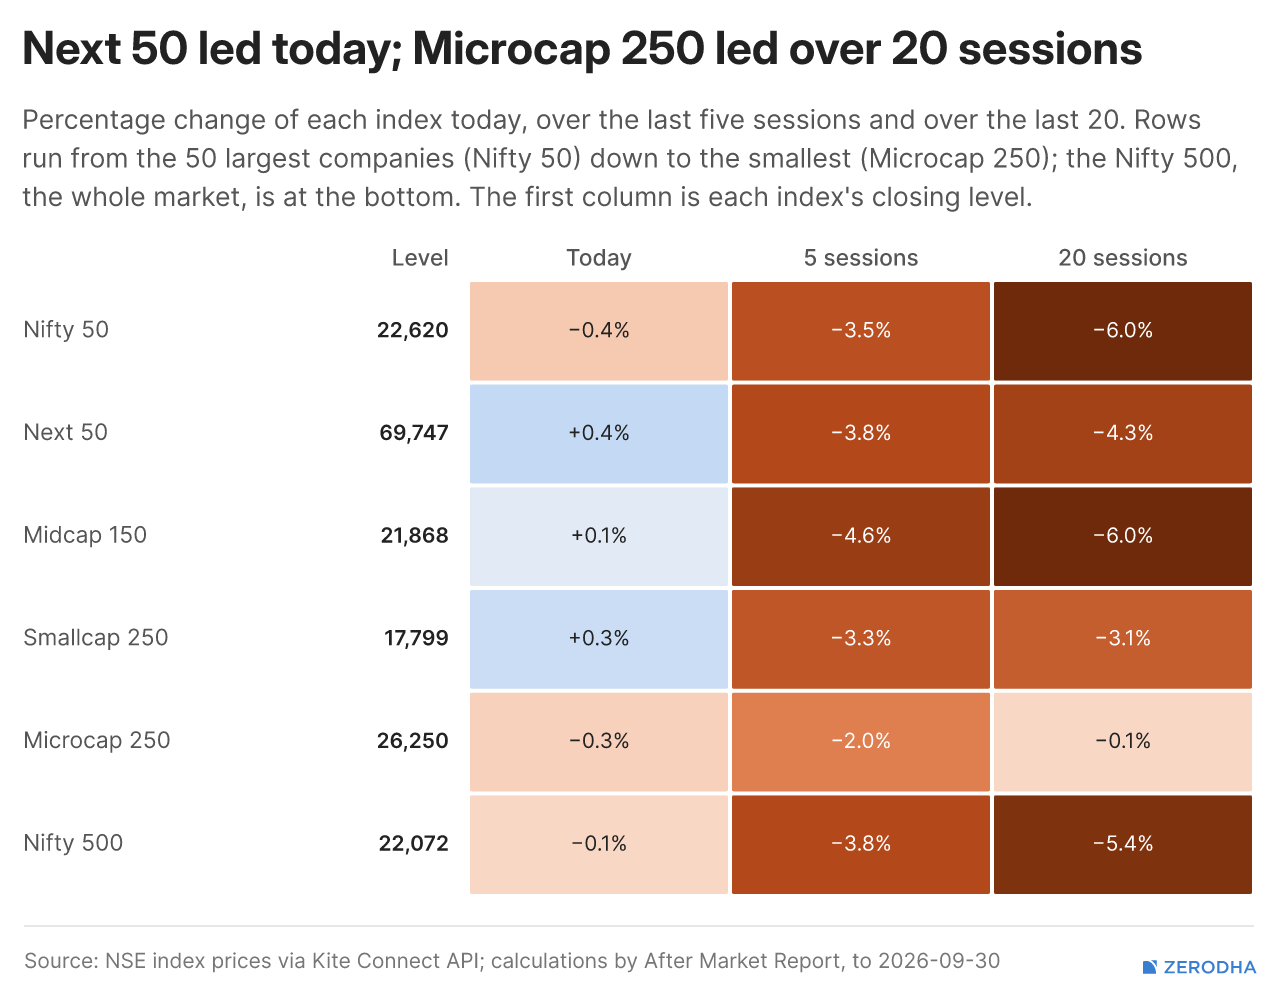
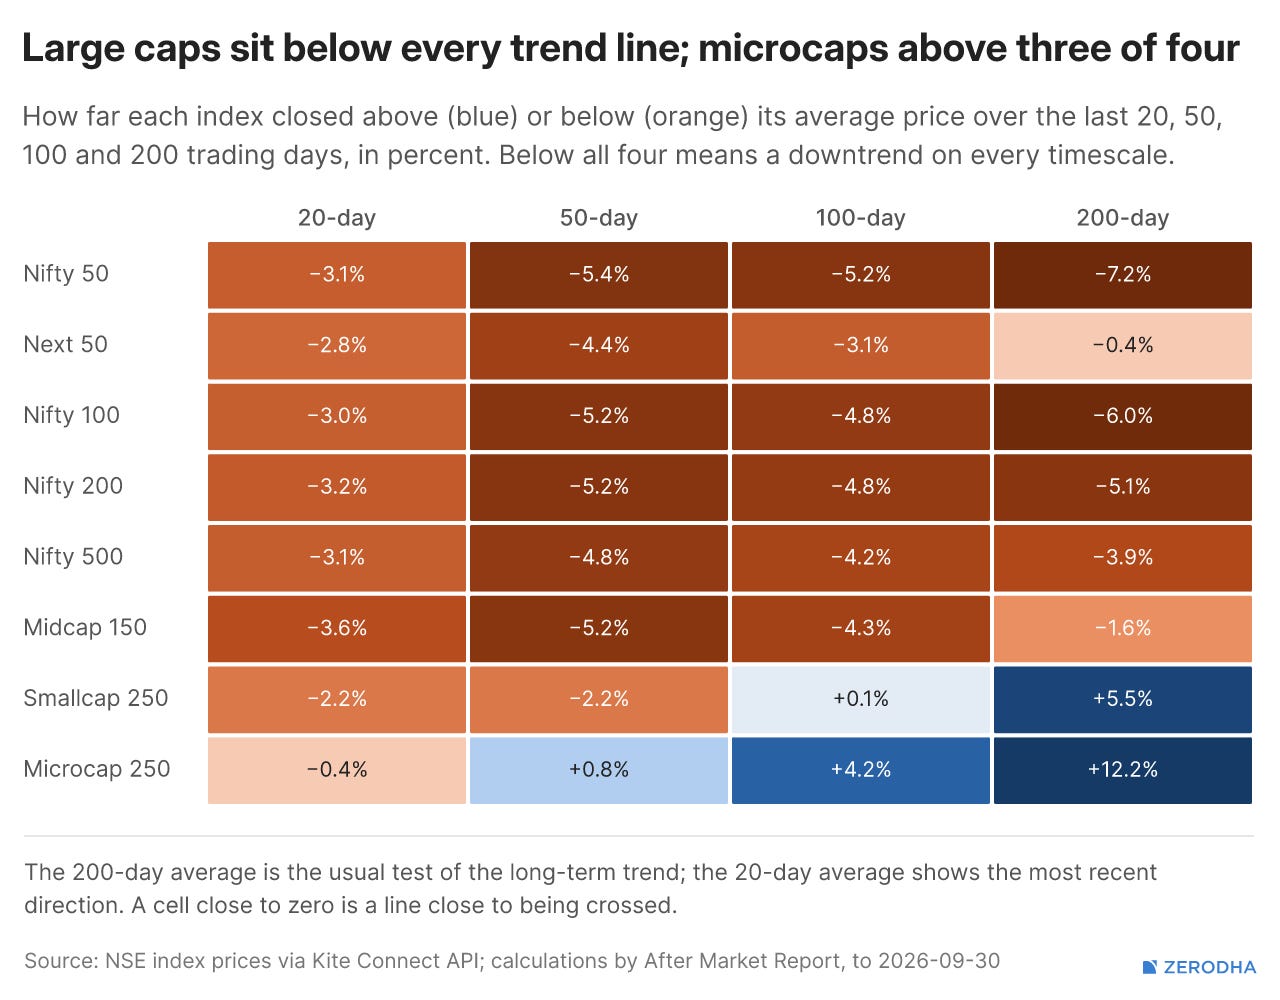
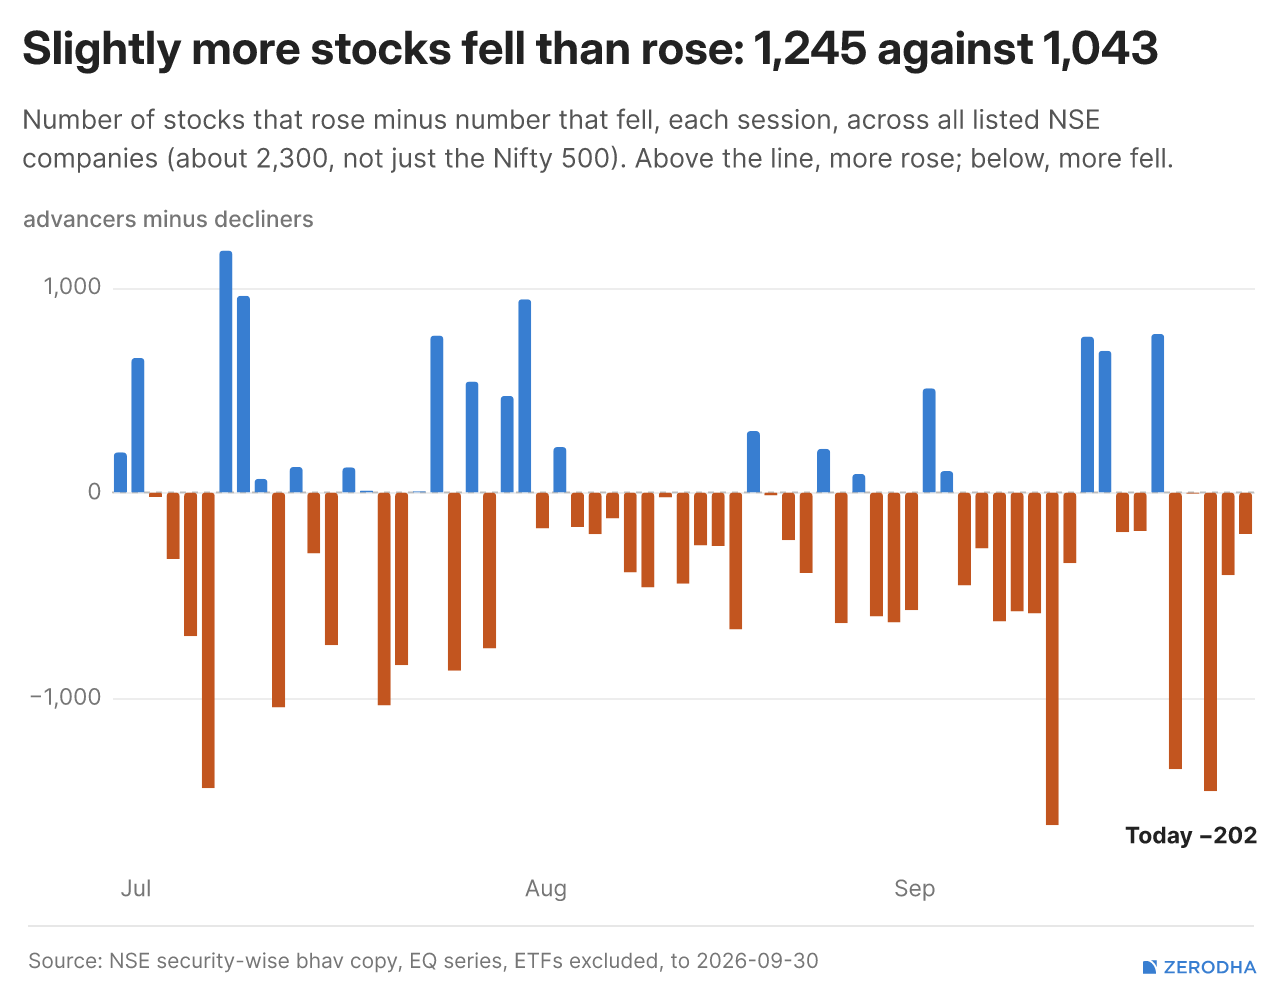
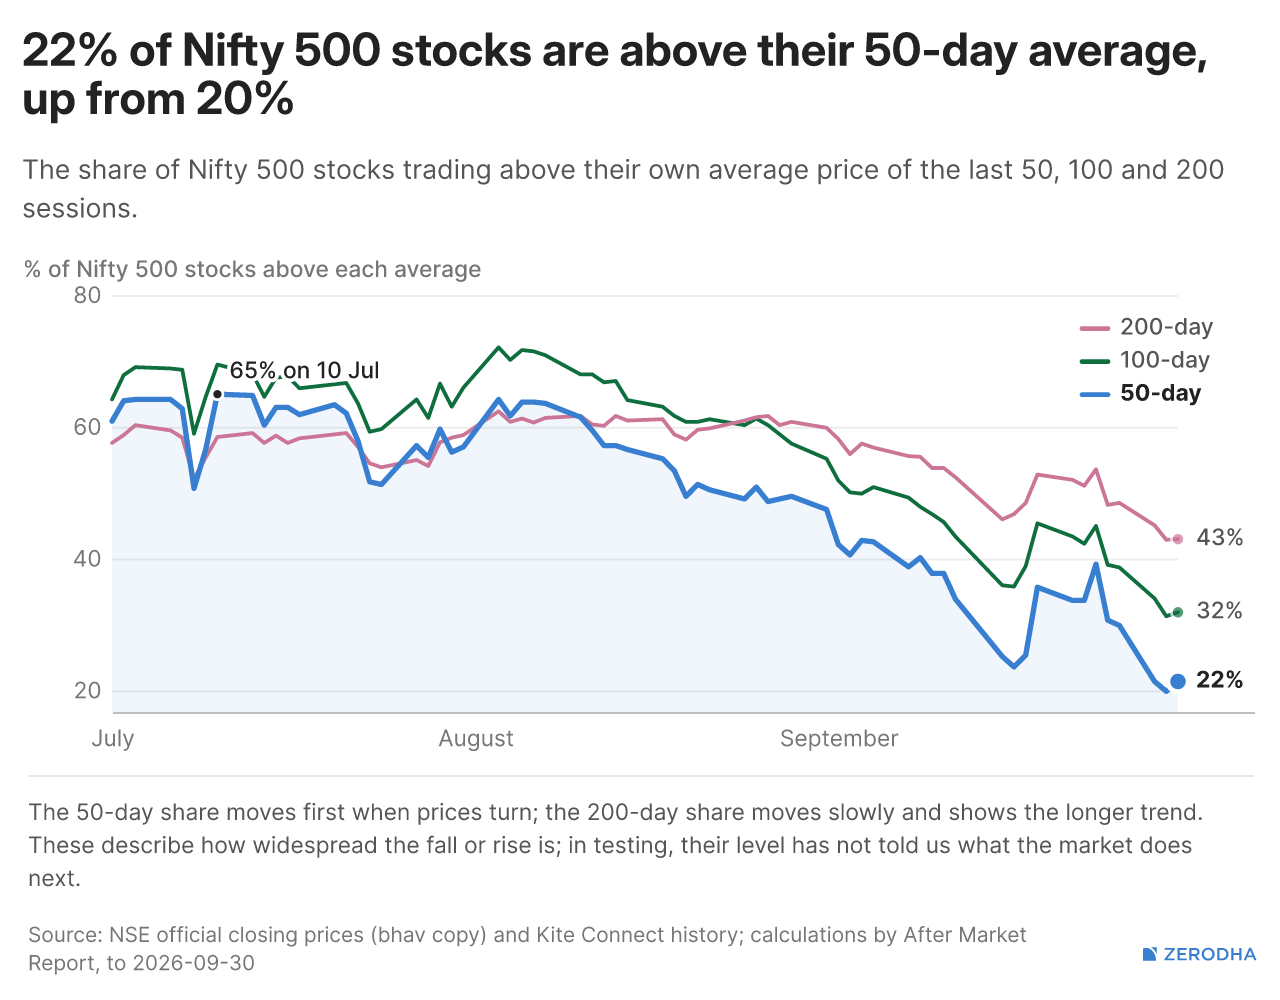
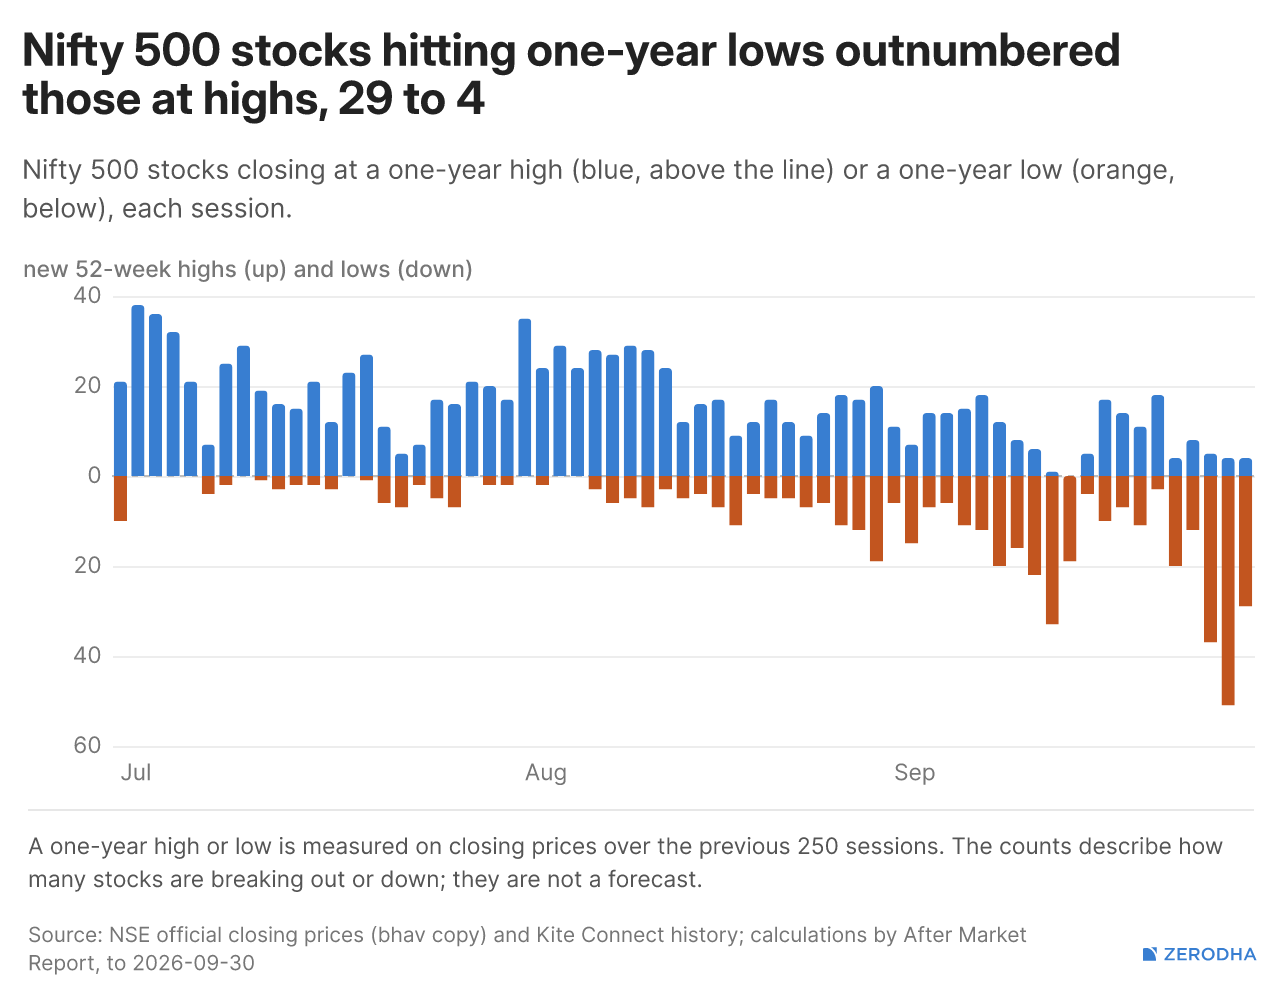
Breadth was mixed with 1,043 advancers versus 1,245 decliners, while the share of Nifty 500 stocks above their 50-day average improved slightly to 21.5%. However, 52-week lows continued to dominate highs by 29 to 4.
52 Week Highs & Lows
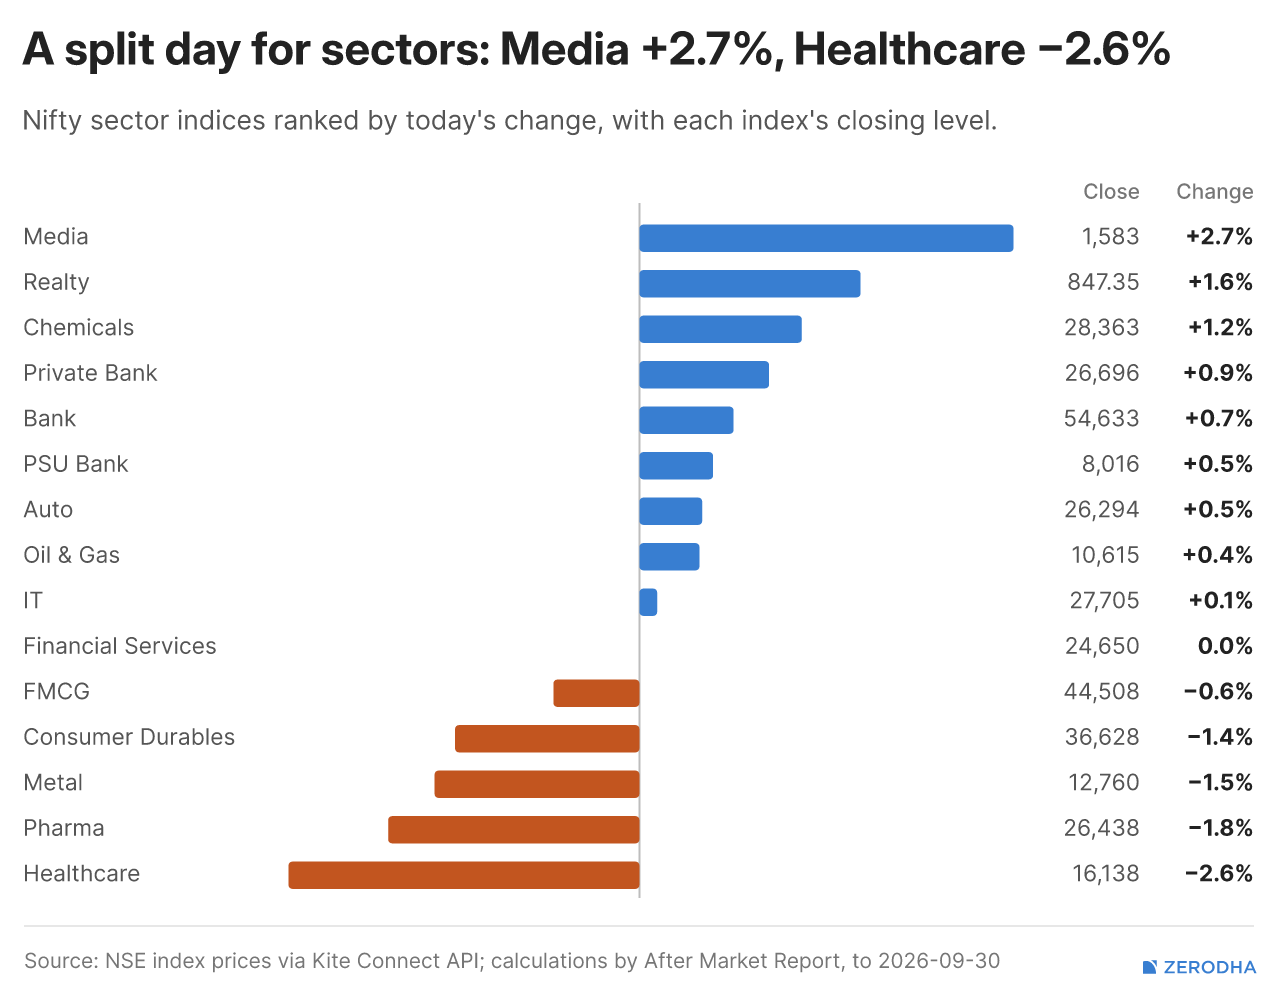
Sectoral Indices Performance
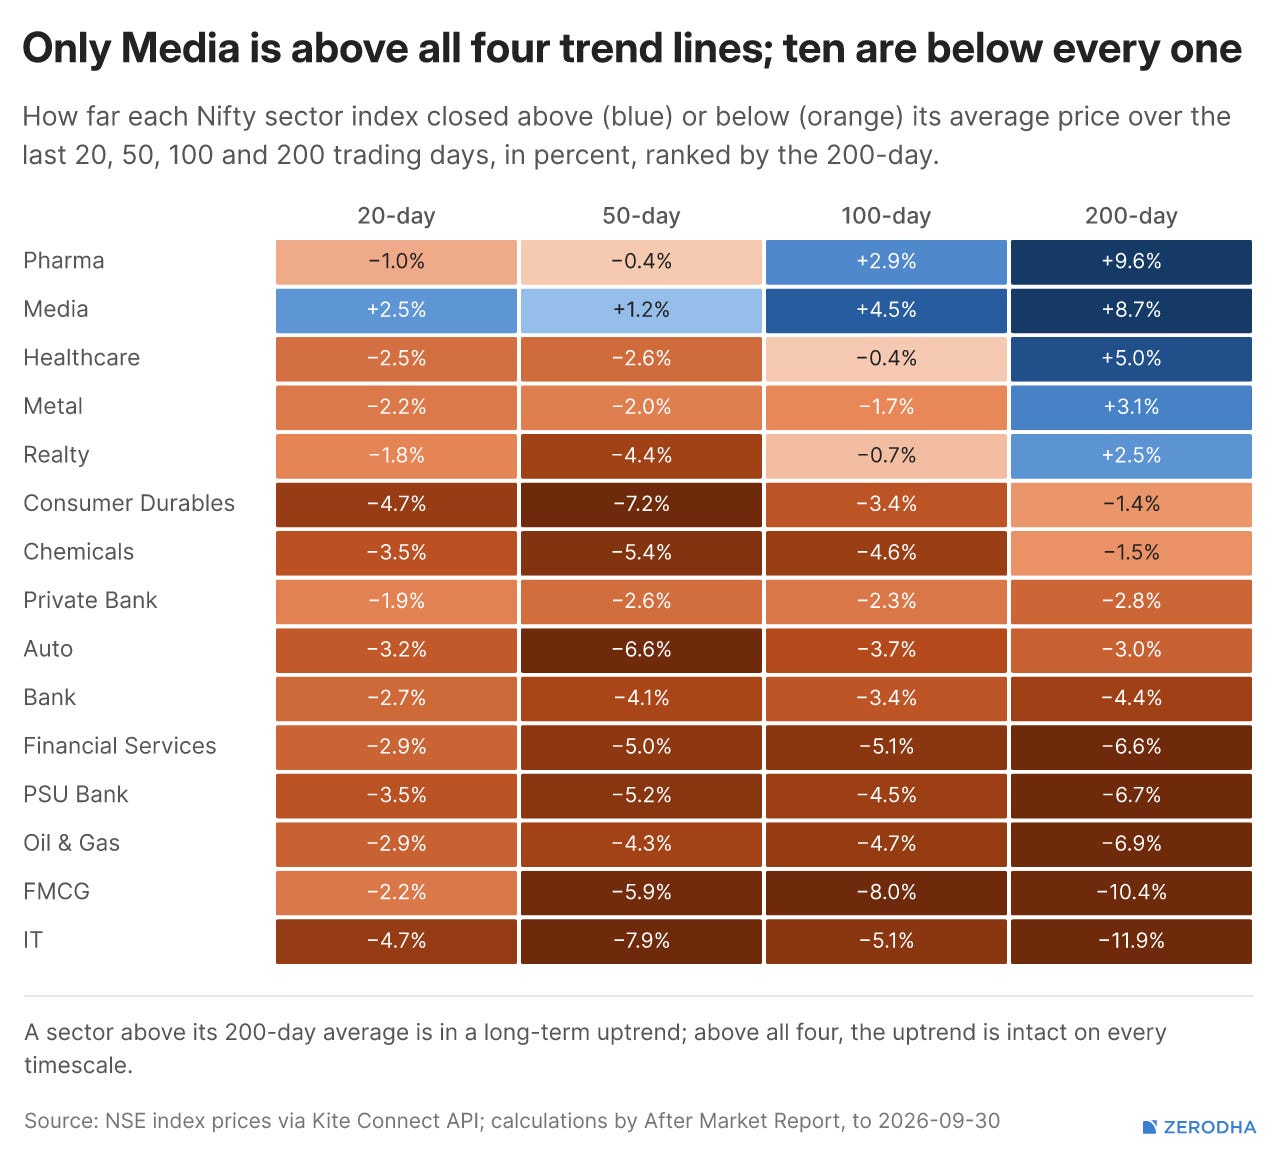
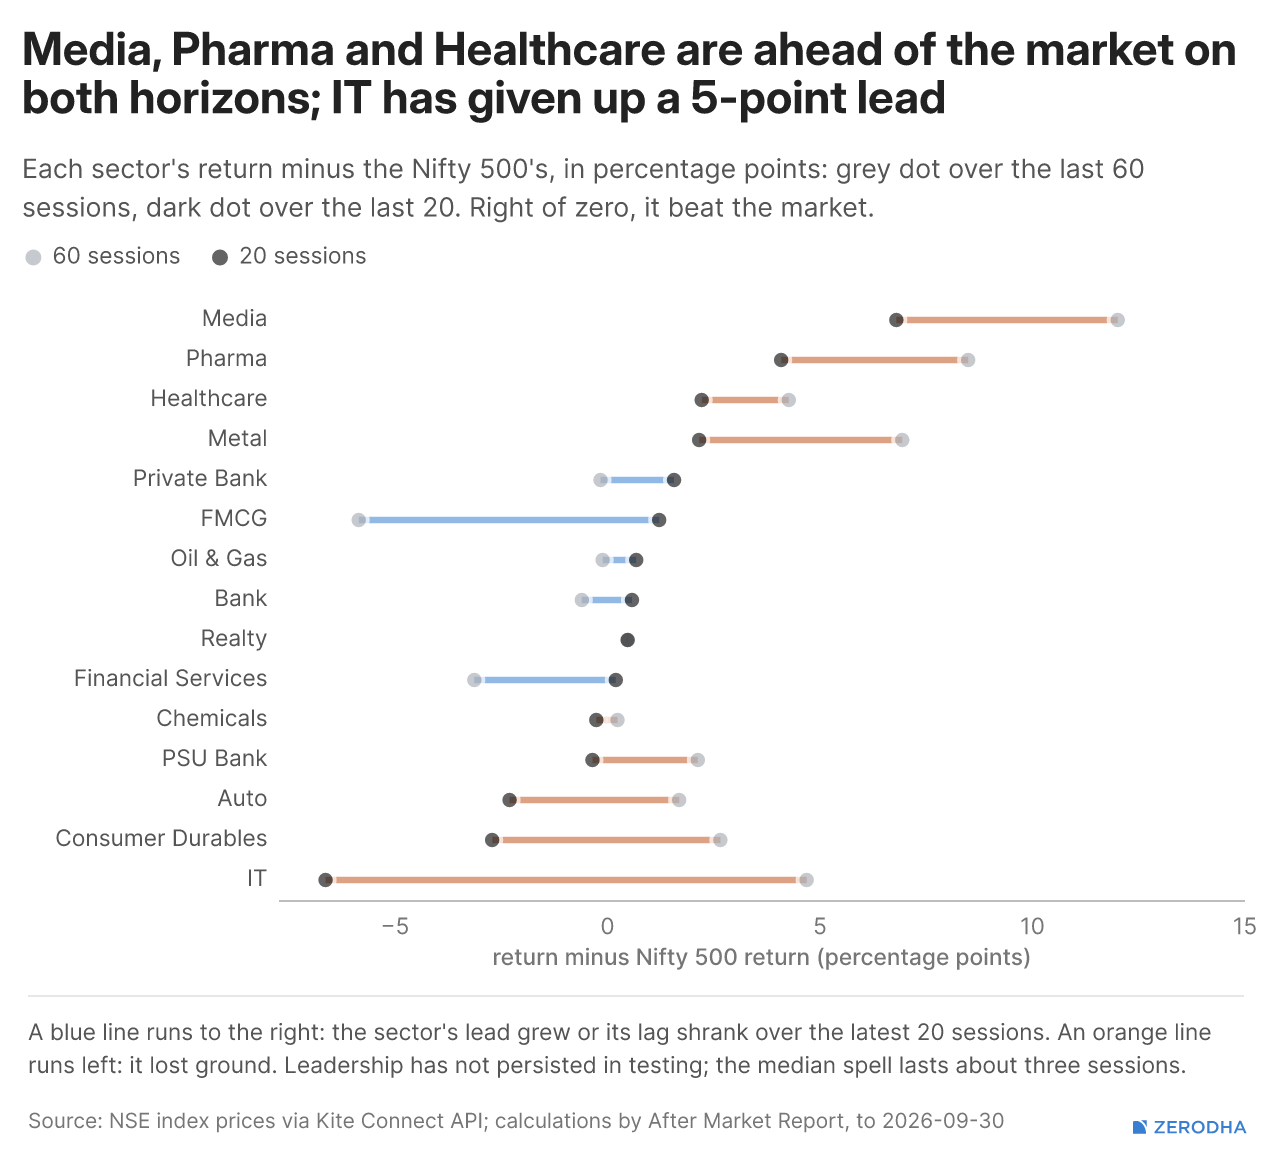
Media surged 2.74% to lead while Healthcare fell 2.57%, with nine of 15 sectors gaining. Media, Pharma and Healthcare remain ahead of the Nifty 500 over both 20 and 60 sessions, though Media is now the only sector above all four key moving averages.
Winners & Losers
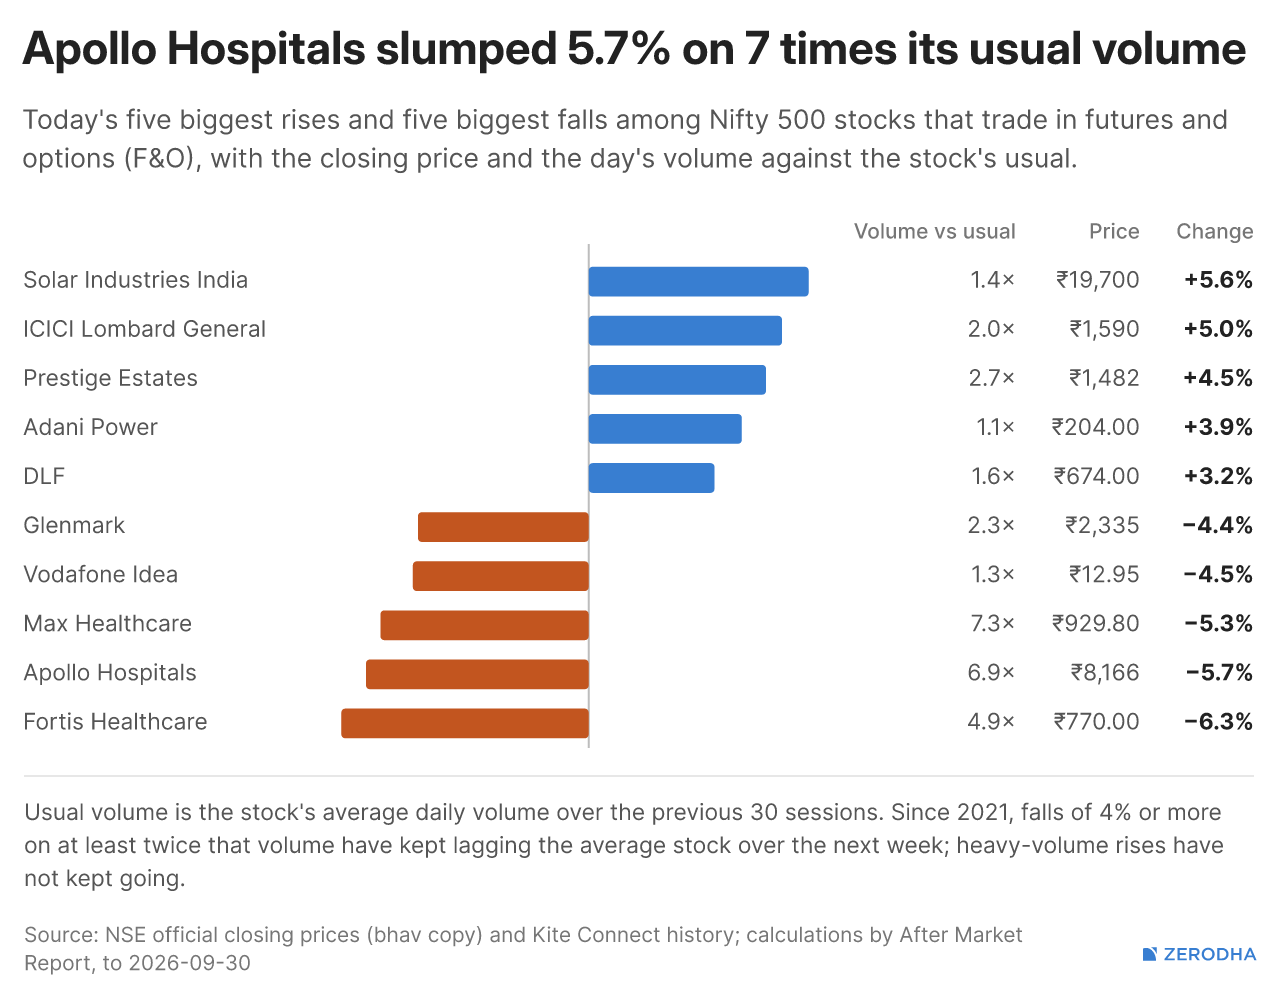
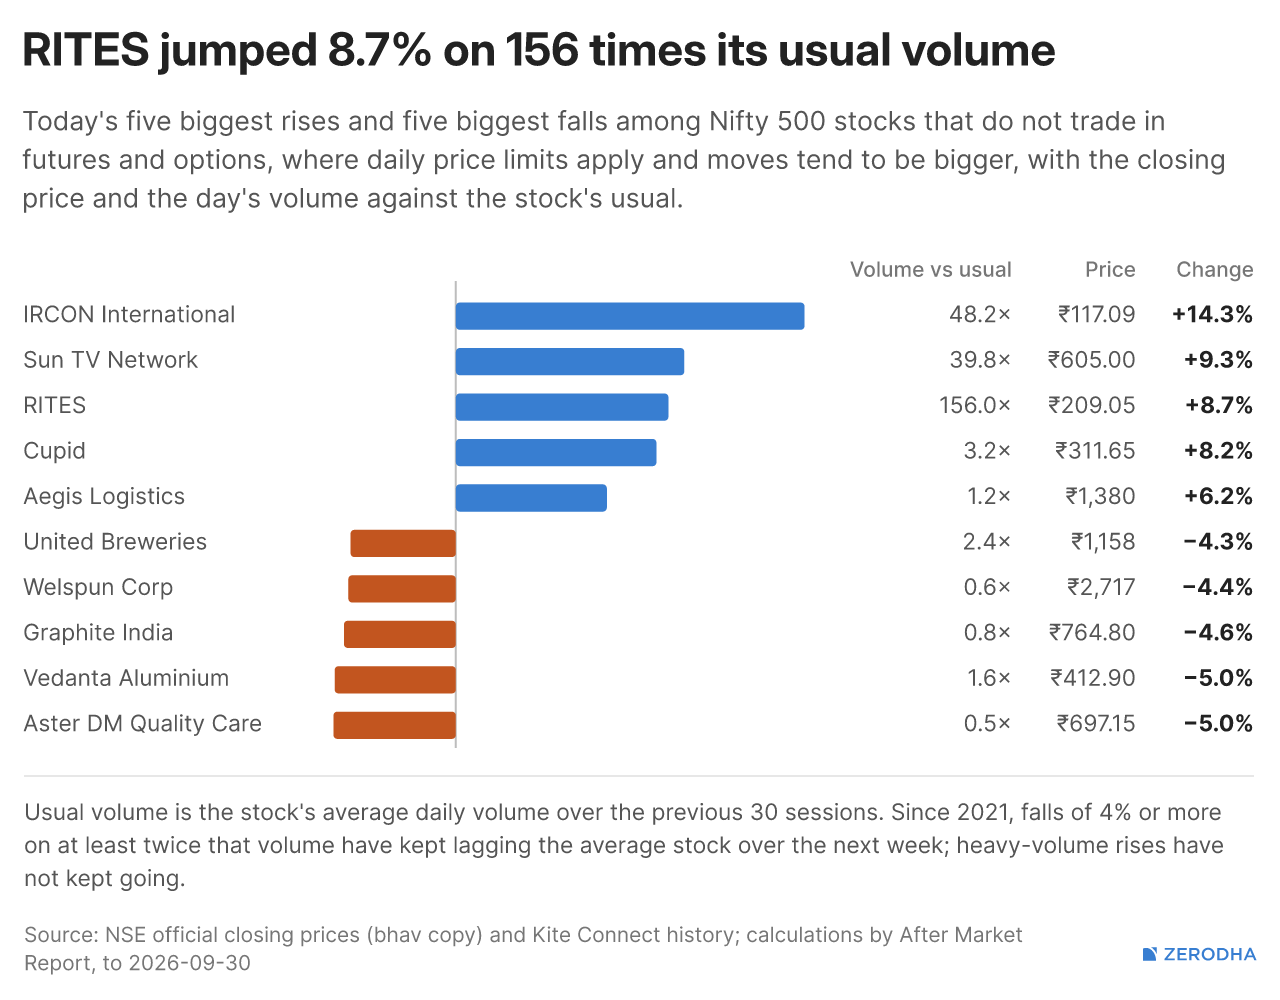
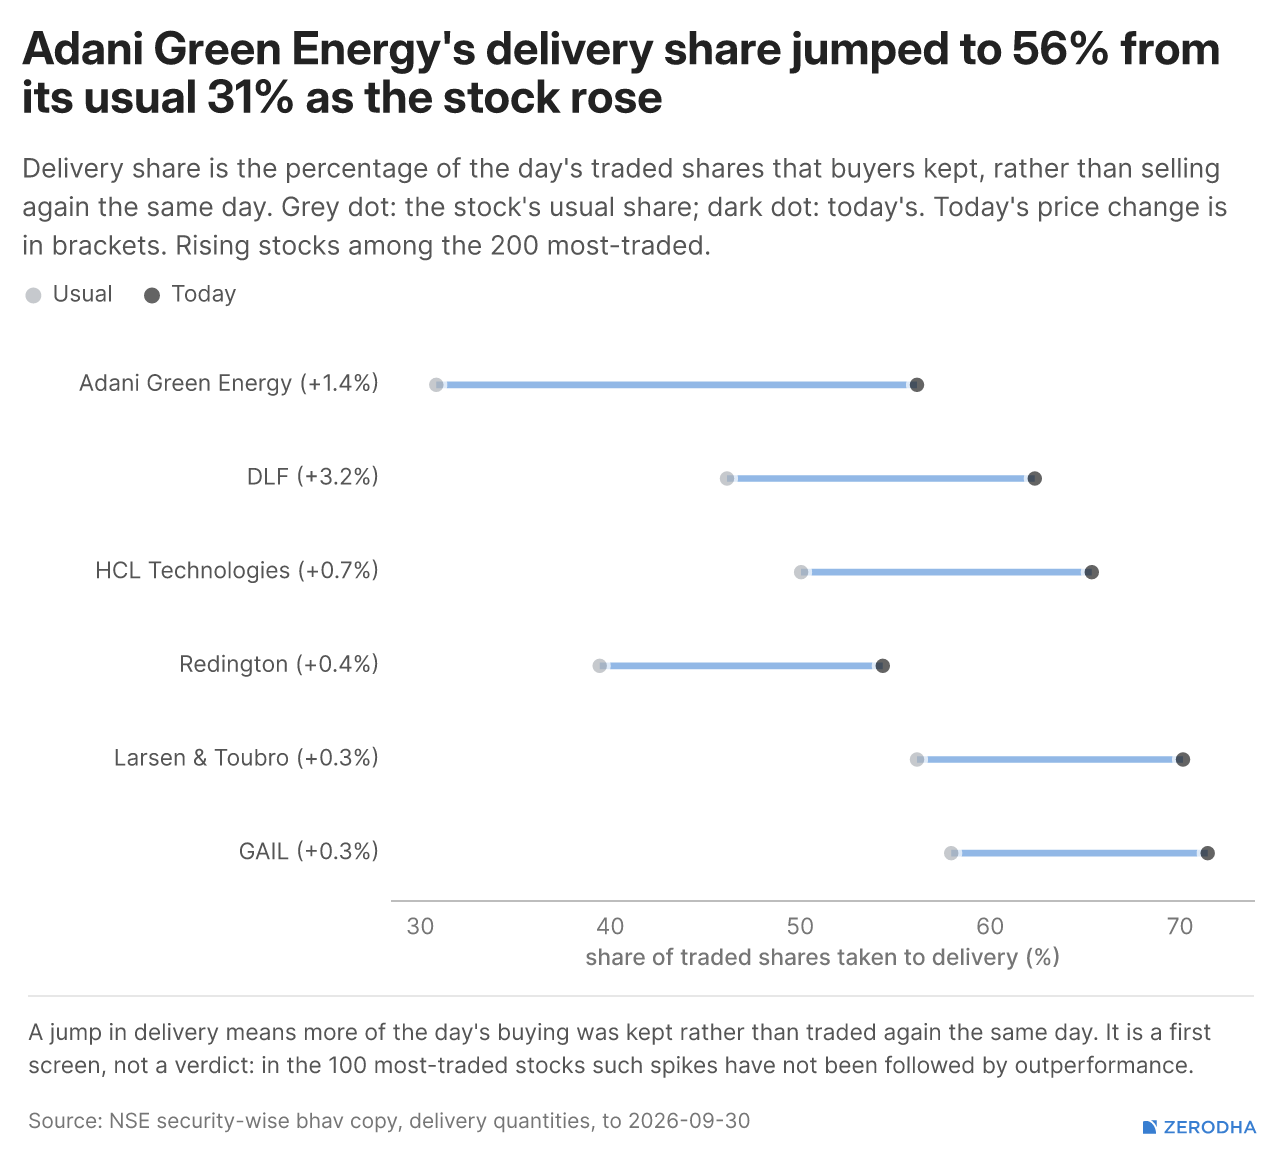
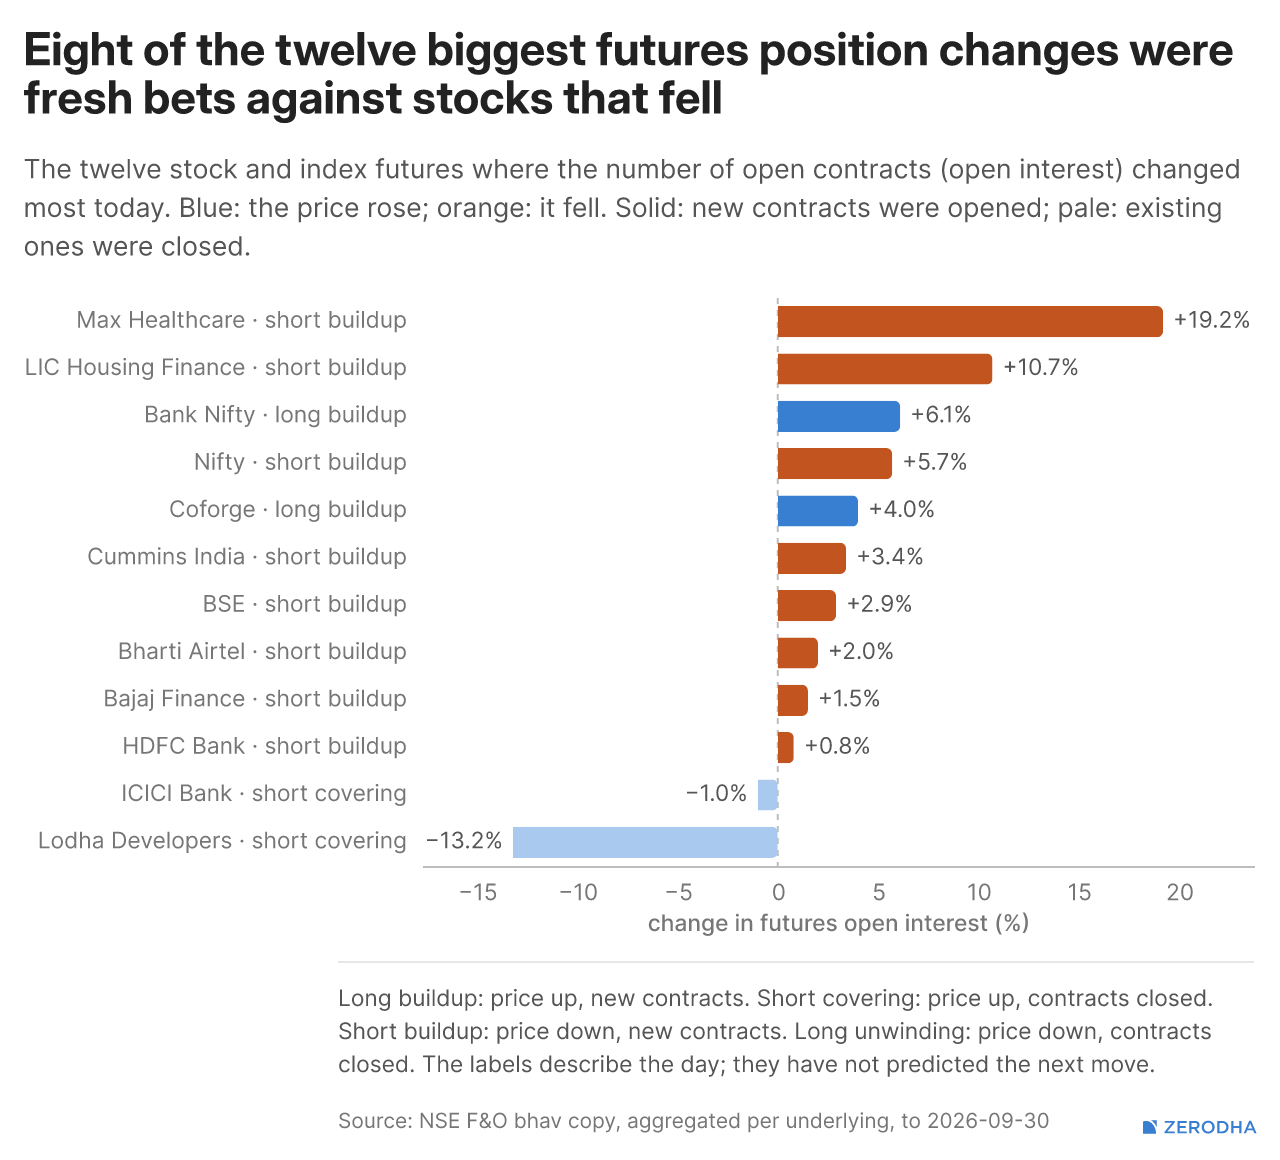
RITES jumped 8.70% on 156× usual volume, while IRCON surged 14.27% on 48× volume. Healthcare stocks occupied four of the five worst F&O slots, while Adani Green saw the sharpest delivery spike.
Delivery Data
Global Markets
Commodities
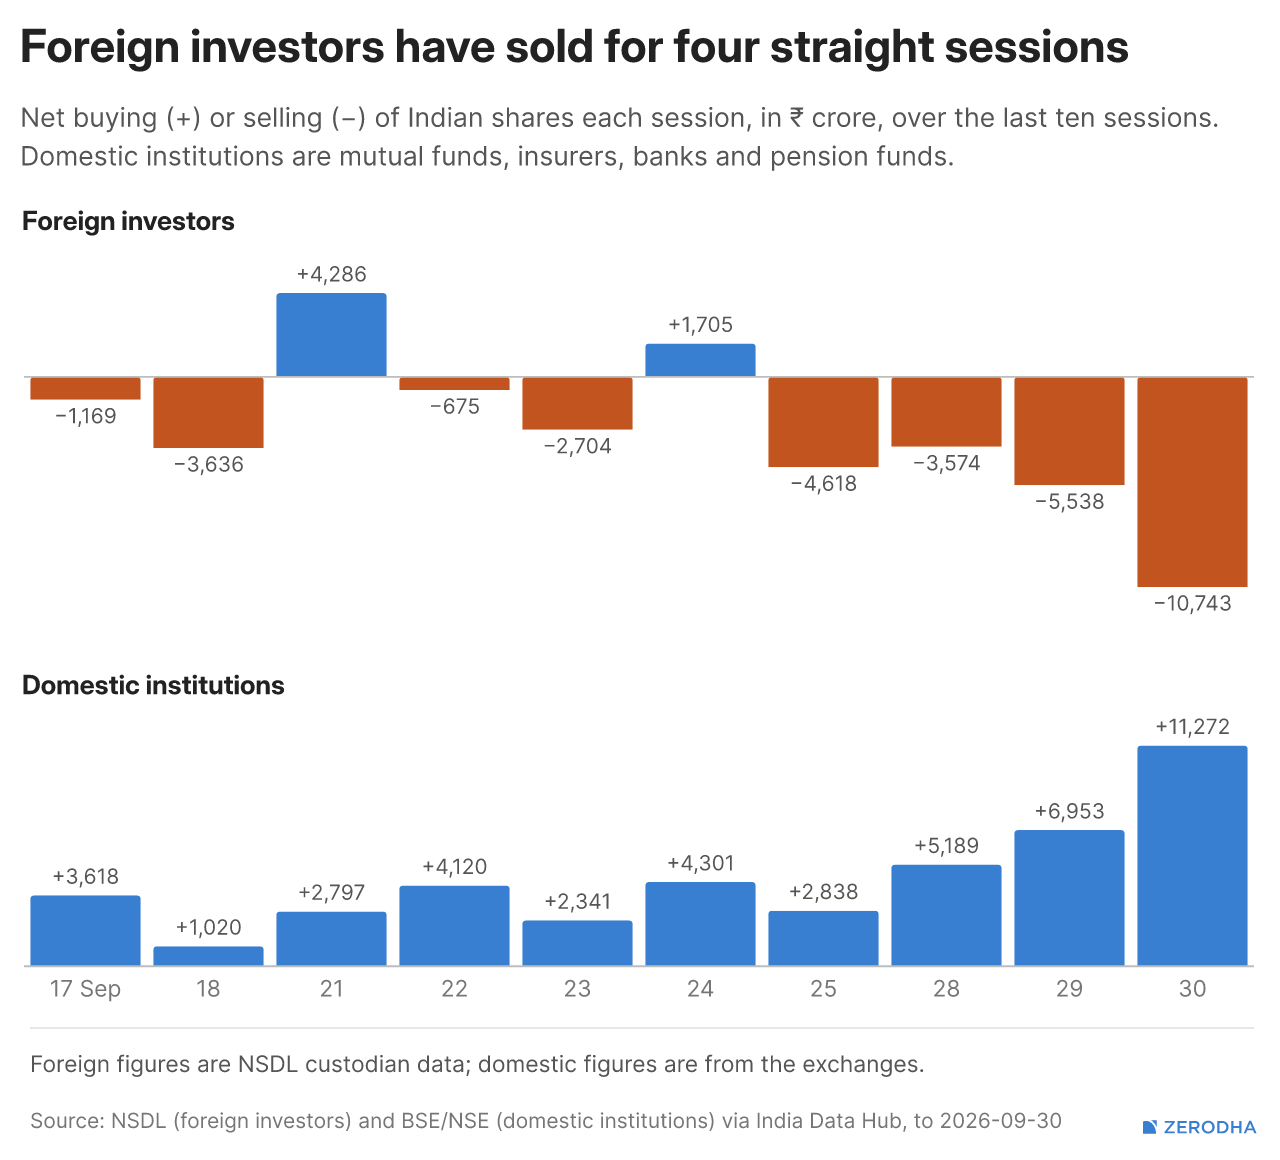
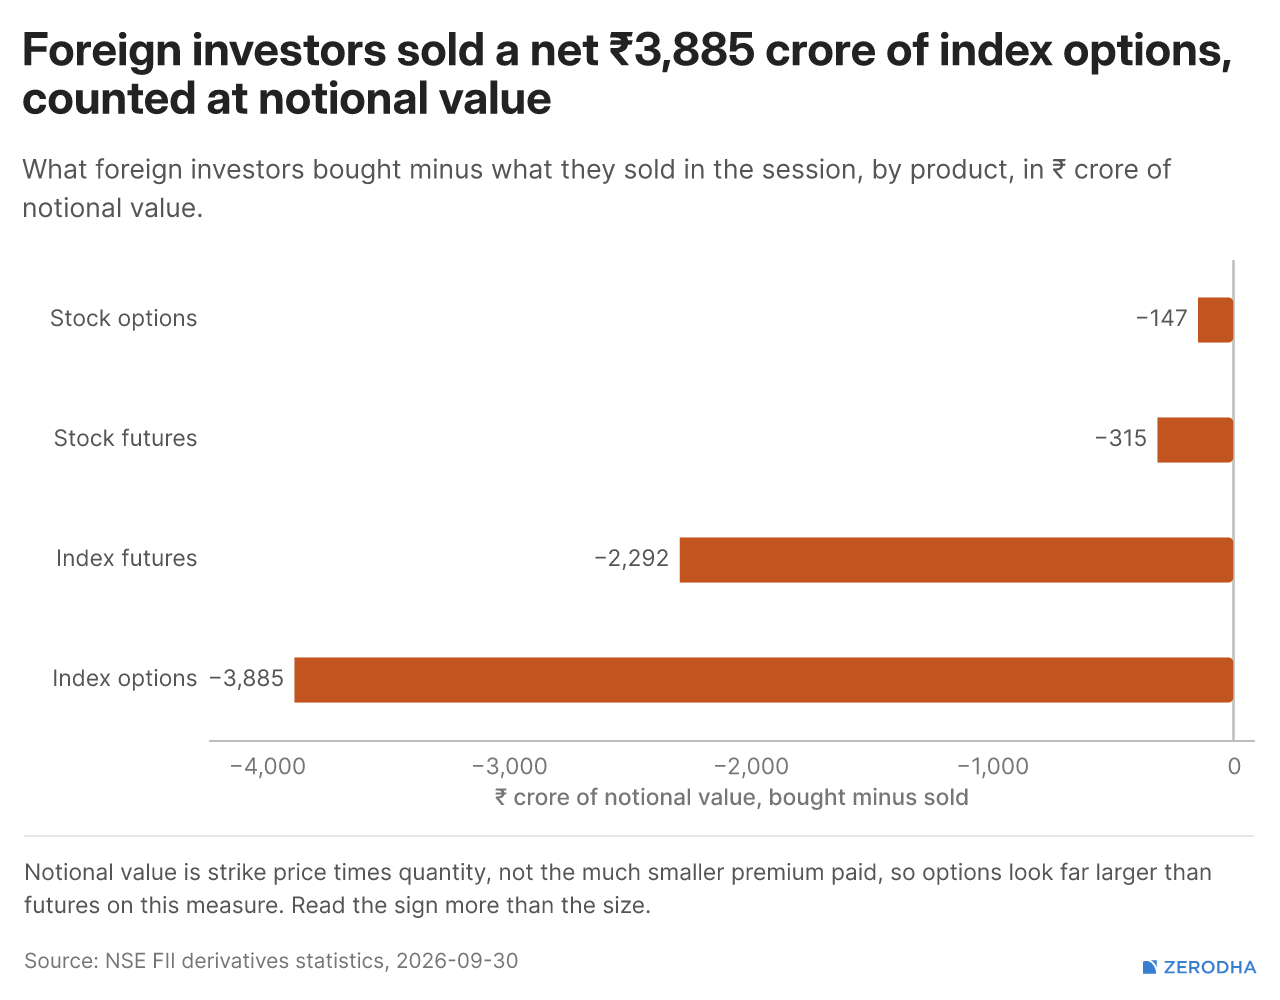
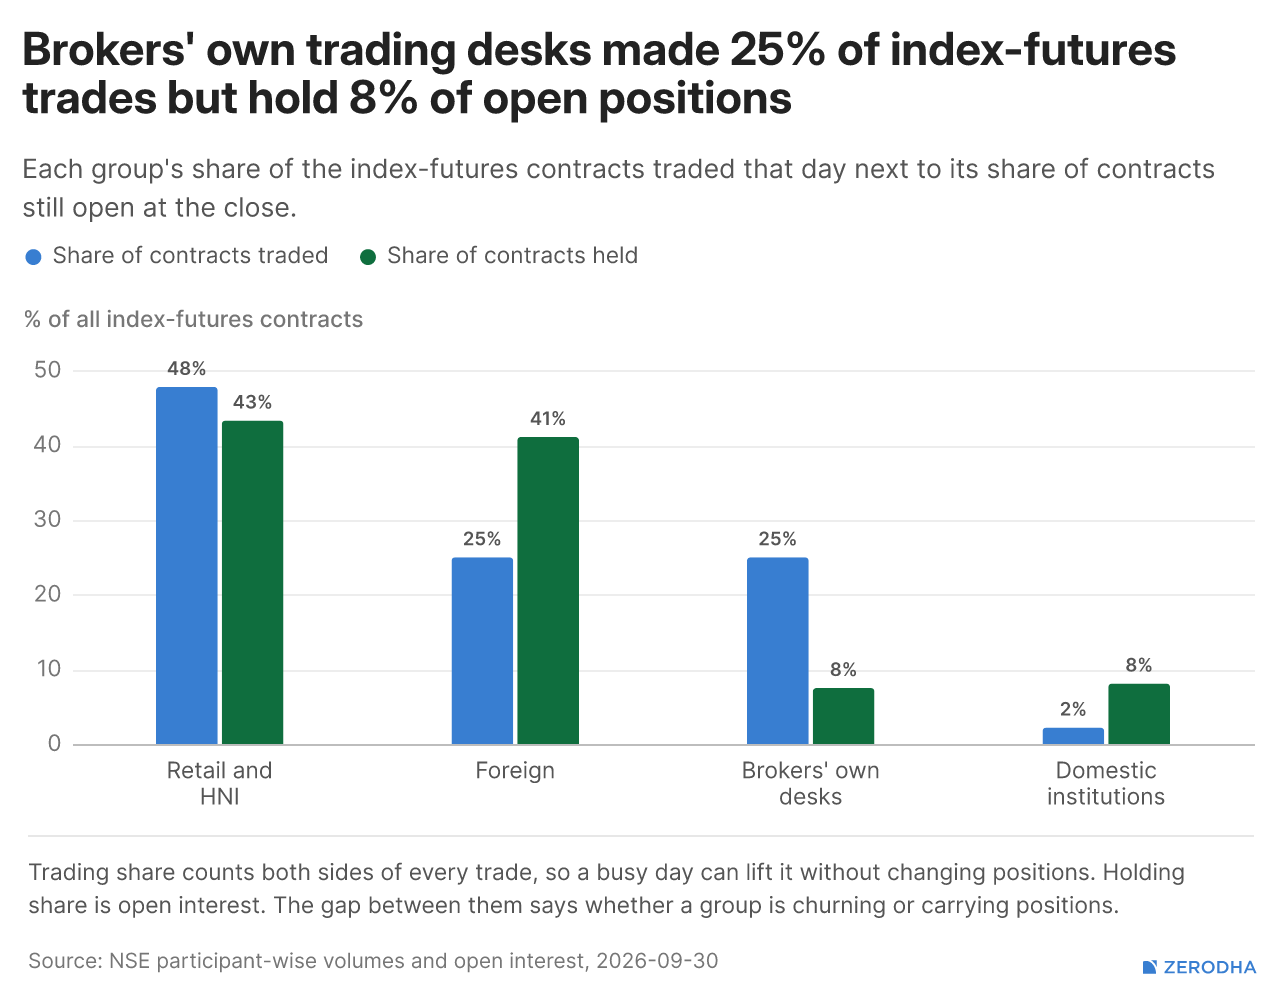
Institutional Flows & Participant Positioning
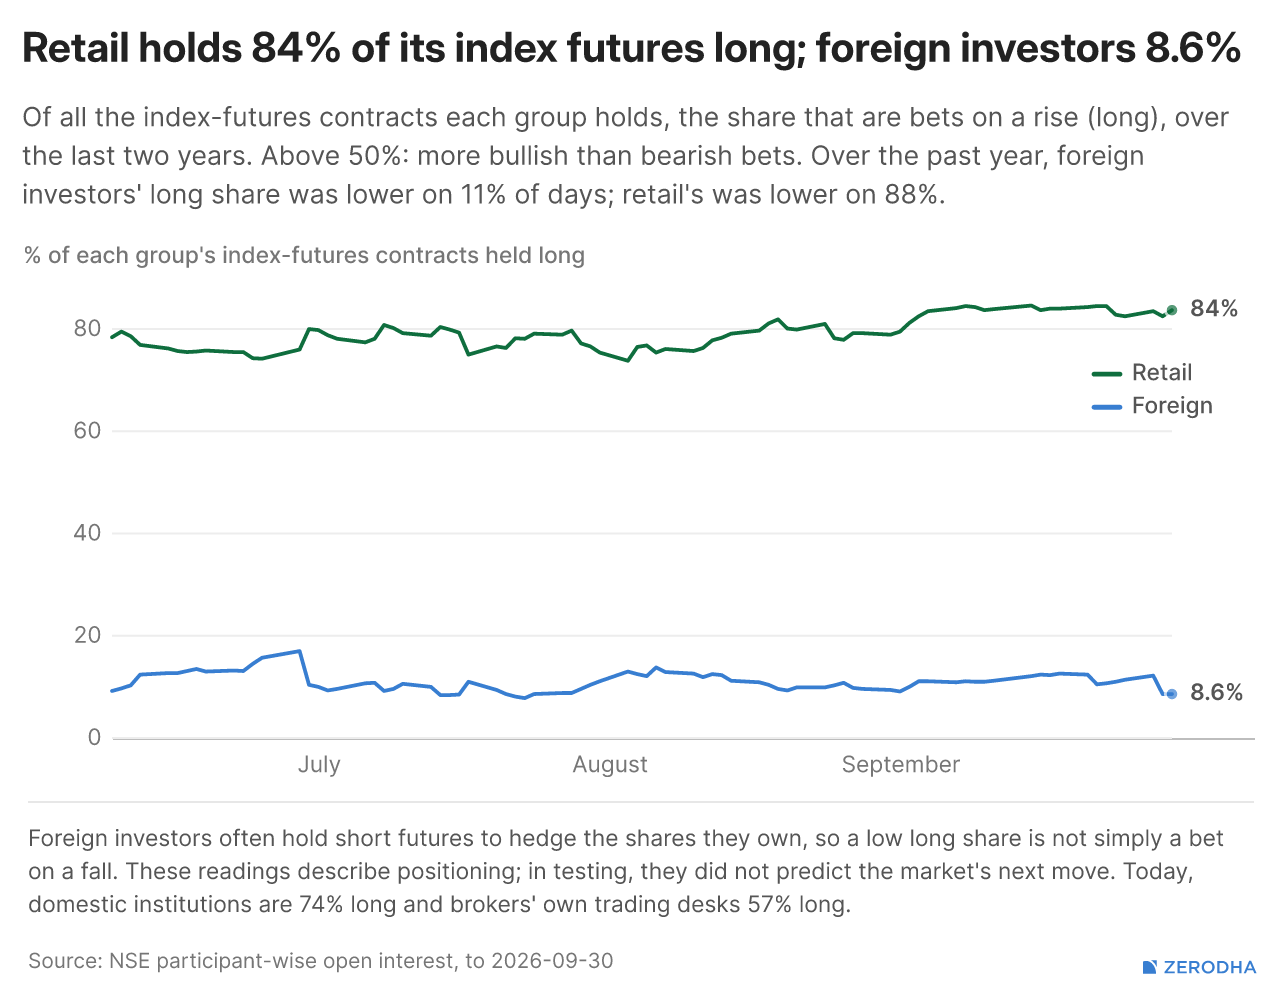
FIIs remain heavily bearish with just 8.6% of index-futures positions long,
Thematic Indices
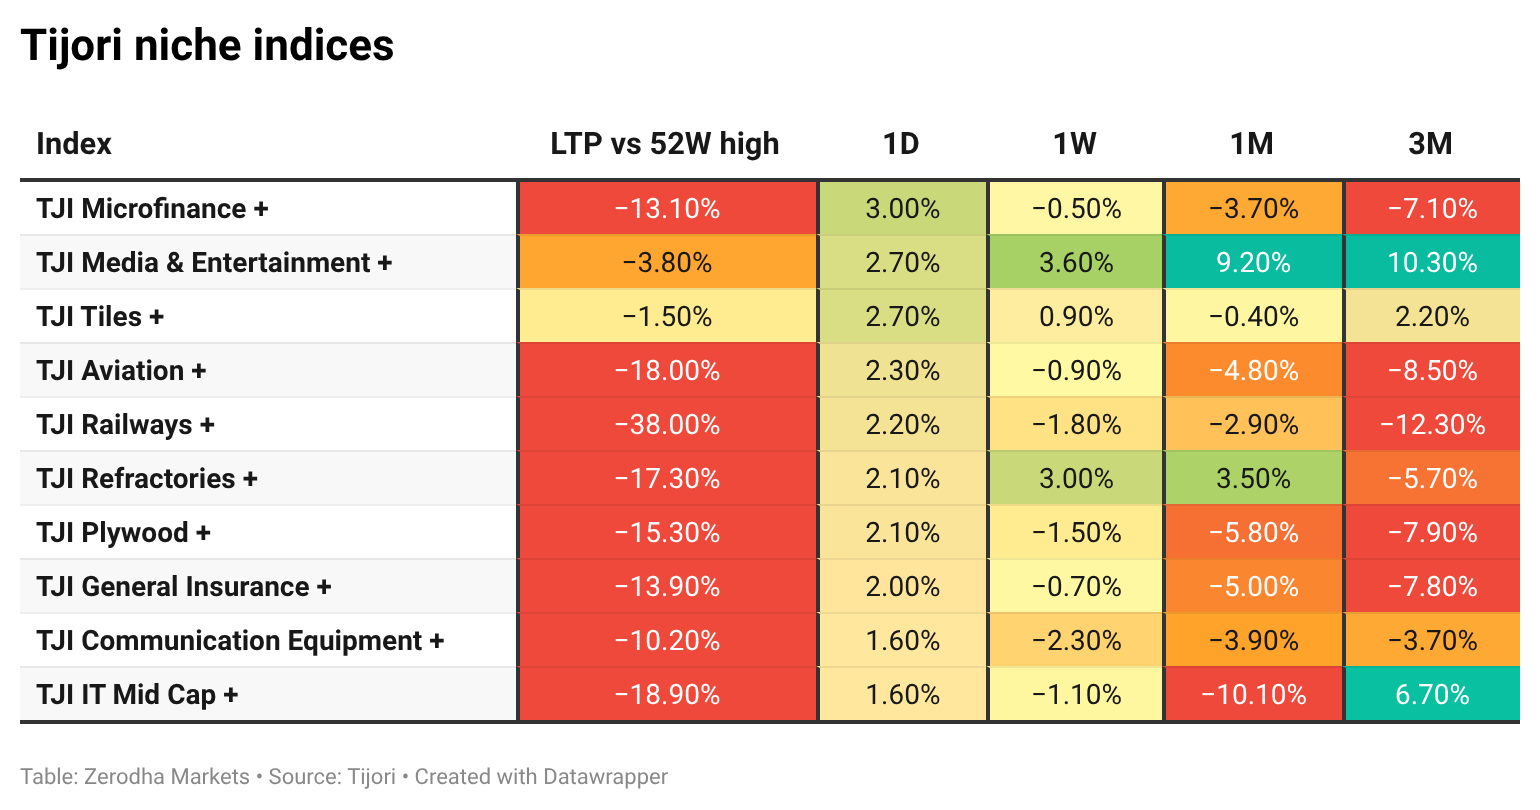
Tijori’s niche indices, where today’s move sorts pockets of the market beyond standard sector baskets. You can also track promoter buying and other interesting stuff, like Capex activity by the companies in the Tijori App’s idea dashboard
F&O Corner
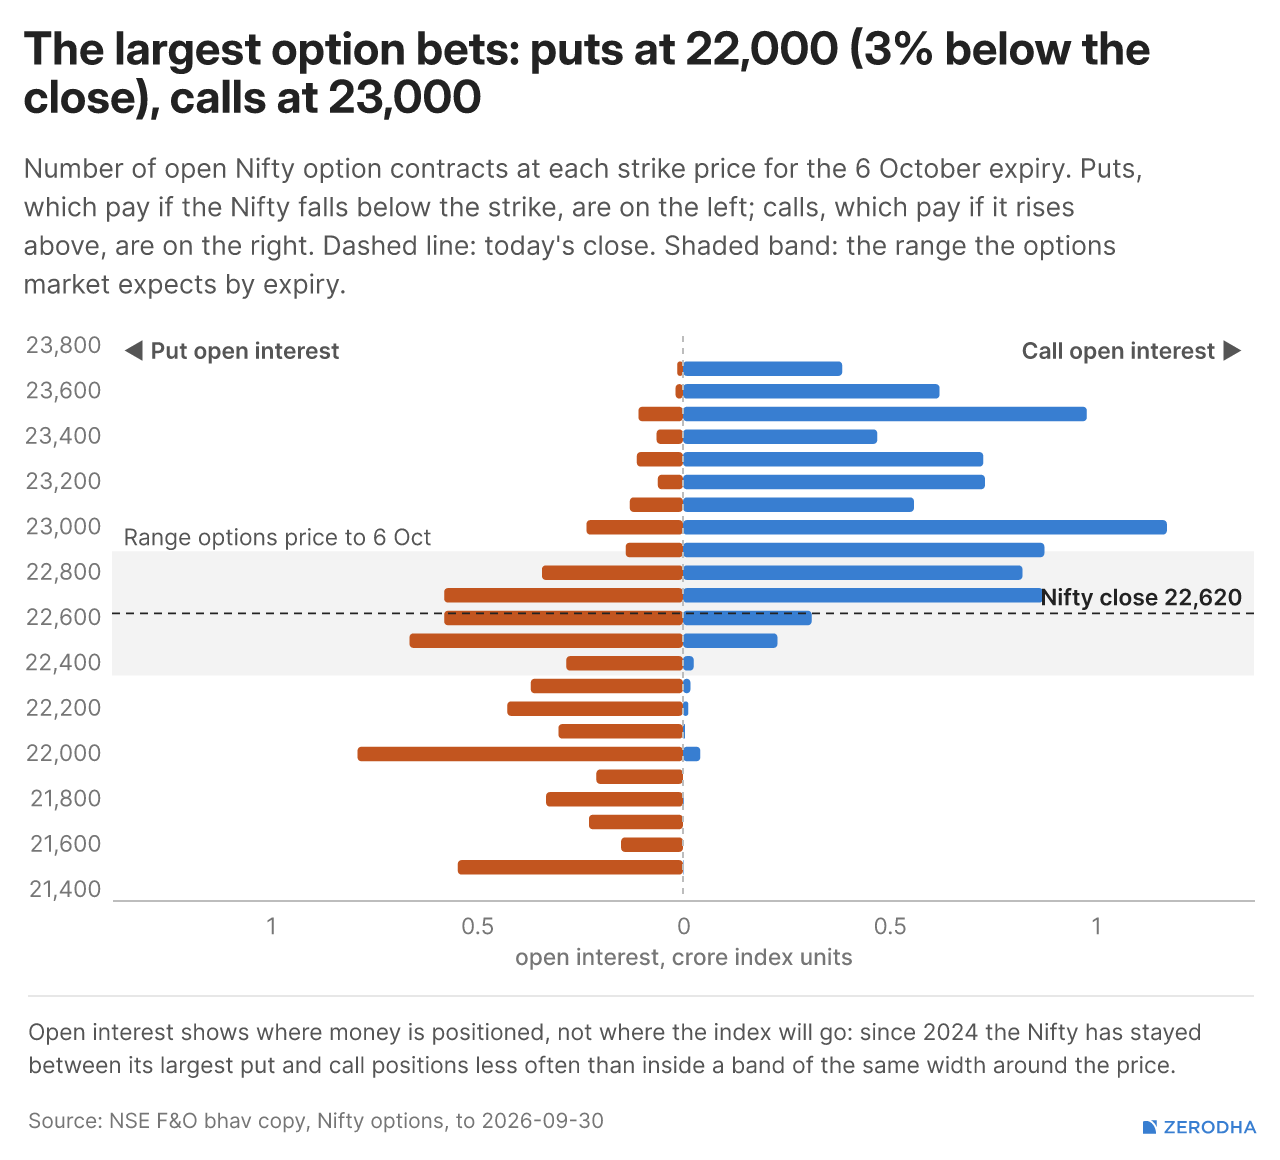
Options price a roughly 275-point move either way into October 6 expiry, while PCR fell from 0.89 to 0.79 as call writers remained more active.
Options imply a 22,375–22,924 range, with the heaviest put OI at 22,000 and call OI at 23,000. The 20-day moving average at 23,344 remains the first major trend hurdle.

Top Stories in India
India ended the 2026 southwest monsoon season with rainfall at 87% of normal, a 13% deficit. Around 313 of 741 districts received deficient or large-deficient rainfall, while 15 states and UTs recorded below-normal rains. Dive deeper
The Centre’s fiscal deficit reached ₹7.1 lakh crore during April-August FY27, equivalent to 41.9% of the full-year target. This compares with 38.1% of the budget estimate during the same period last year. Dive deeper
The Cabinet approved the ₹1.86 lakh crore Green Energy Corridor Phase-III, aimed at integrating and evacuating 135 GW of renewable energy across states. The scheme also includes ₹50,000 crore for 50 GWh of battery storage and is targeted for completion by FY33. Dive deeper
The government notified the CAFE-3 fuel-efficiency norms aimed at lowering vehicle carbon emissions, without a separate concession for small cars. Maruti Suzuki, which has a large small-car portfolio, had pushed for such relief. Dive deeper
Apple Pay is set to roll out in India over the coming weeks, enabling in-app, online and physical-store payments across Apple devices. Axis Bank credit cards on Visa and Mastercard will be supported, while PayU has partnered with Apple for merchant acceptance. Dive deeper
JSW Cement will merge listed subsidiary Shiva Cement into itself, creating a unified cement platform. Shiva Cement shareholders will receive 5 JSW Cement shares for every 41 shares held. Dive deeper
Tube Investments will invest ₹250 crore in electric-mobility subsidiary TI Clean Mobility through Series C preference shares. The investment will support the scaling up of its clean-mobility operations. Dive deeper
Top Stories Globally
Crude oil climbed back above $90 per barrel and was on track for a monthly gain of over 5%, as uncertainty around US-Iran negotiations supported prices. Iran said it had received a US proposal regarding the reopening of the Strait of Hormuz, after submitting its own conditions last week. Dive deeper
The US economy grew at an annualised 2.2% in Q2 2026, revised up by 0.7 percentage point, after 2.5% growth in Q1. The upgrade was driven by stronger investment, consumer and government spending, with data-centre construction contributing significantly to non-residential investment. Dive deeper
Germany’s inflation rose to 3.3% in September, the highest since December 2023, and slightly above expectations of 3.2%. Energy inflation surged to 14.9%, driven by higher crude oil prices amid continued US-Iran uncertainty. Dive deeper
US PCE prices rose 0.3% MoM in August, up from a revised 0.1% in July but below expectations of 0.4%. The increase was driven by higher goods and services prices, including a 4.4% jump in gasoline and other energy goods. Dive deeper
China’s official manufacturing PMI rose to 50.1 in September from 49.8 in August, returning to expansion after two months of contraction. Easing weather disruptions and demand linked to the global AI boom supported factory activity. Dive deeper
Chinese AI firm DeepSeek said on Wednesday it has partnered with Huawei Technologies to develop programming tools optimised for DeepSeek has partnered with Huawei to develop and open-source programming tools optimised for Huawei’s Ascend AI chips. The collaboration reflects China’s broader push to build domestic AI infrastructure and reduce reliance on Nvidia. Dive deeper
Tesla has secured $30 billion in credit facilities, including a $20 billion delayed-draw term loan. The funding comes as Tesla ramps up spending on AI computing, solar-cell manufacturing and a semiconductor fabrication project with SpaceX. Dive deeper
Management Chatter
In this section, we highlight interesting comments from management at major companies and from policymakers in the Indian and Global Economies.
Abhinav, VP Finance of Ather Energy, believes the recent acceleration in EV adoption is more than a temporary spike:
“From the perspective of what is happening with the US-Iran war, how crude has behaved, and how fuel has become a concern overall in terms of availability and cost, we are seeing consumer sentiment move towards EVs. This appears to be more of a structural move rather than a short-term move.” - Link
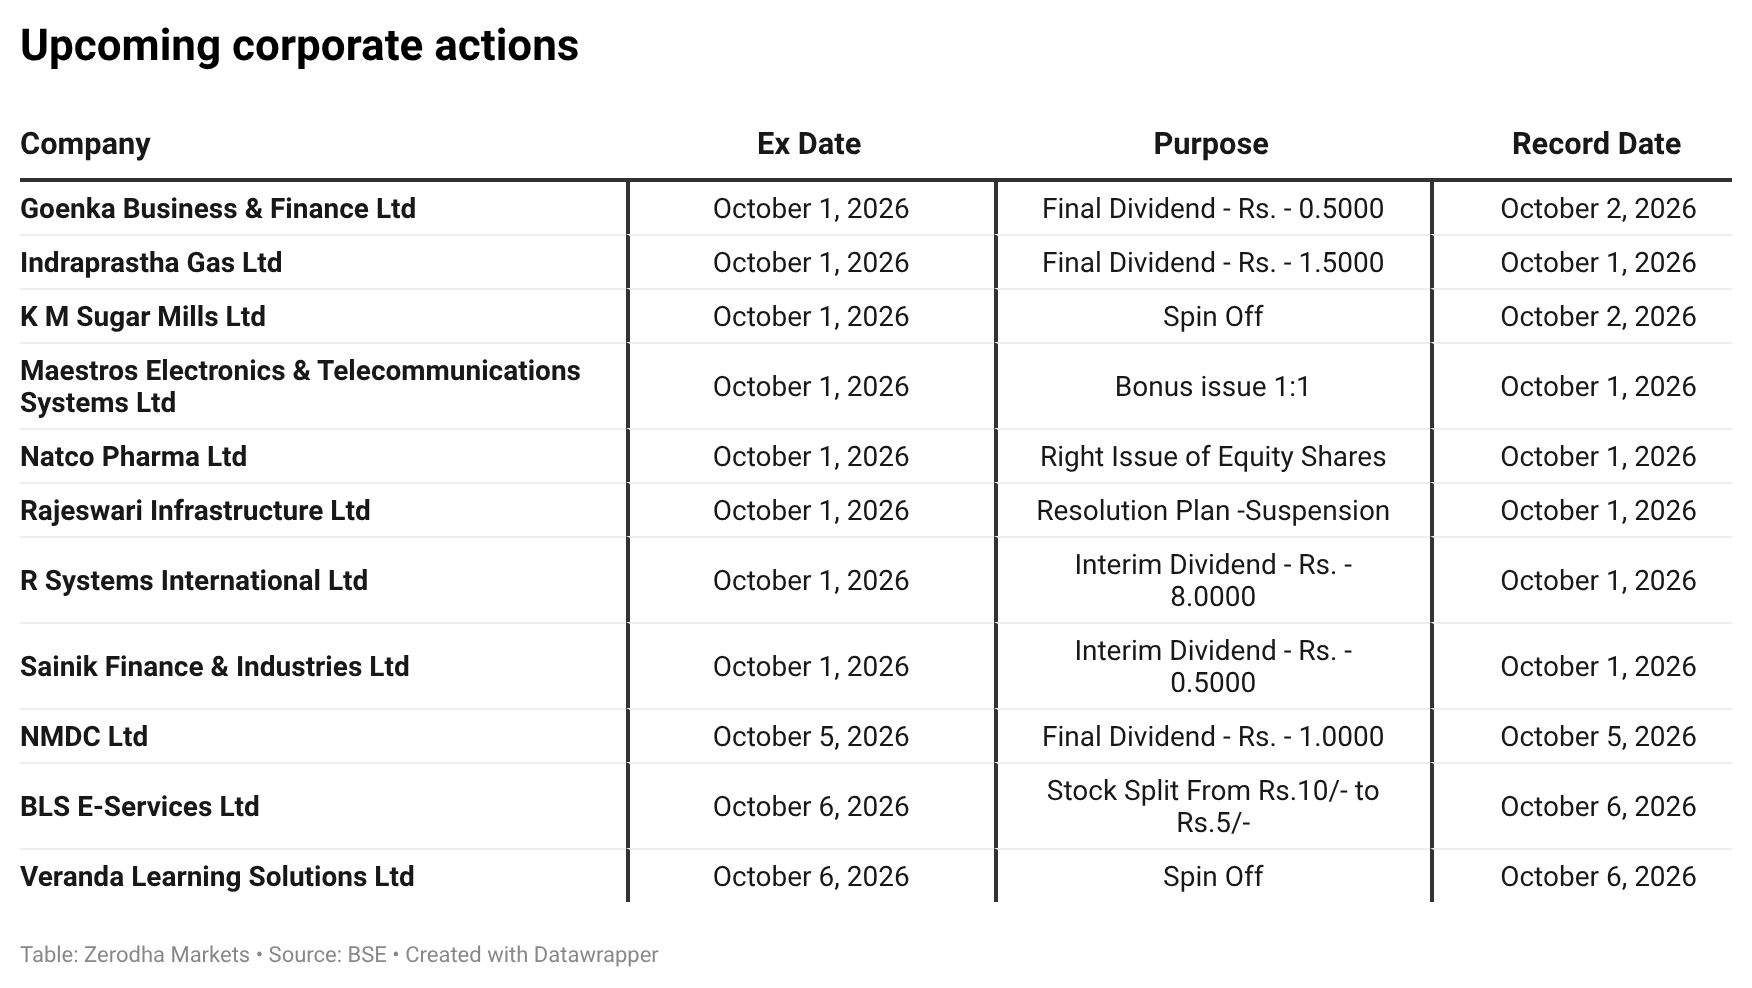
The week ahead & Corporate Actions
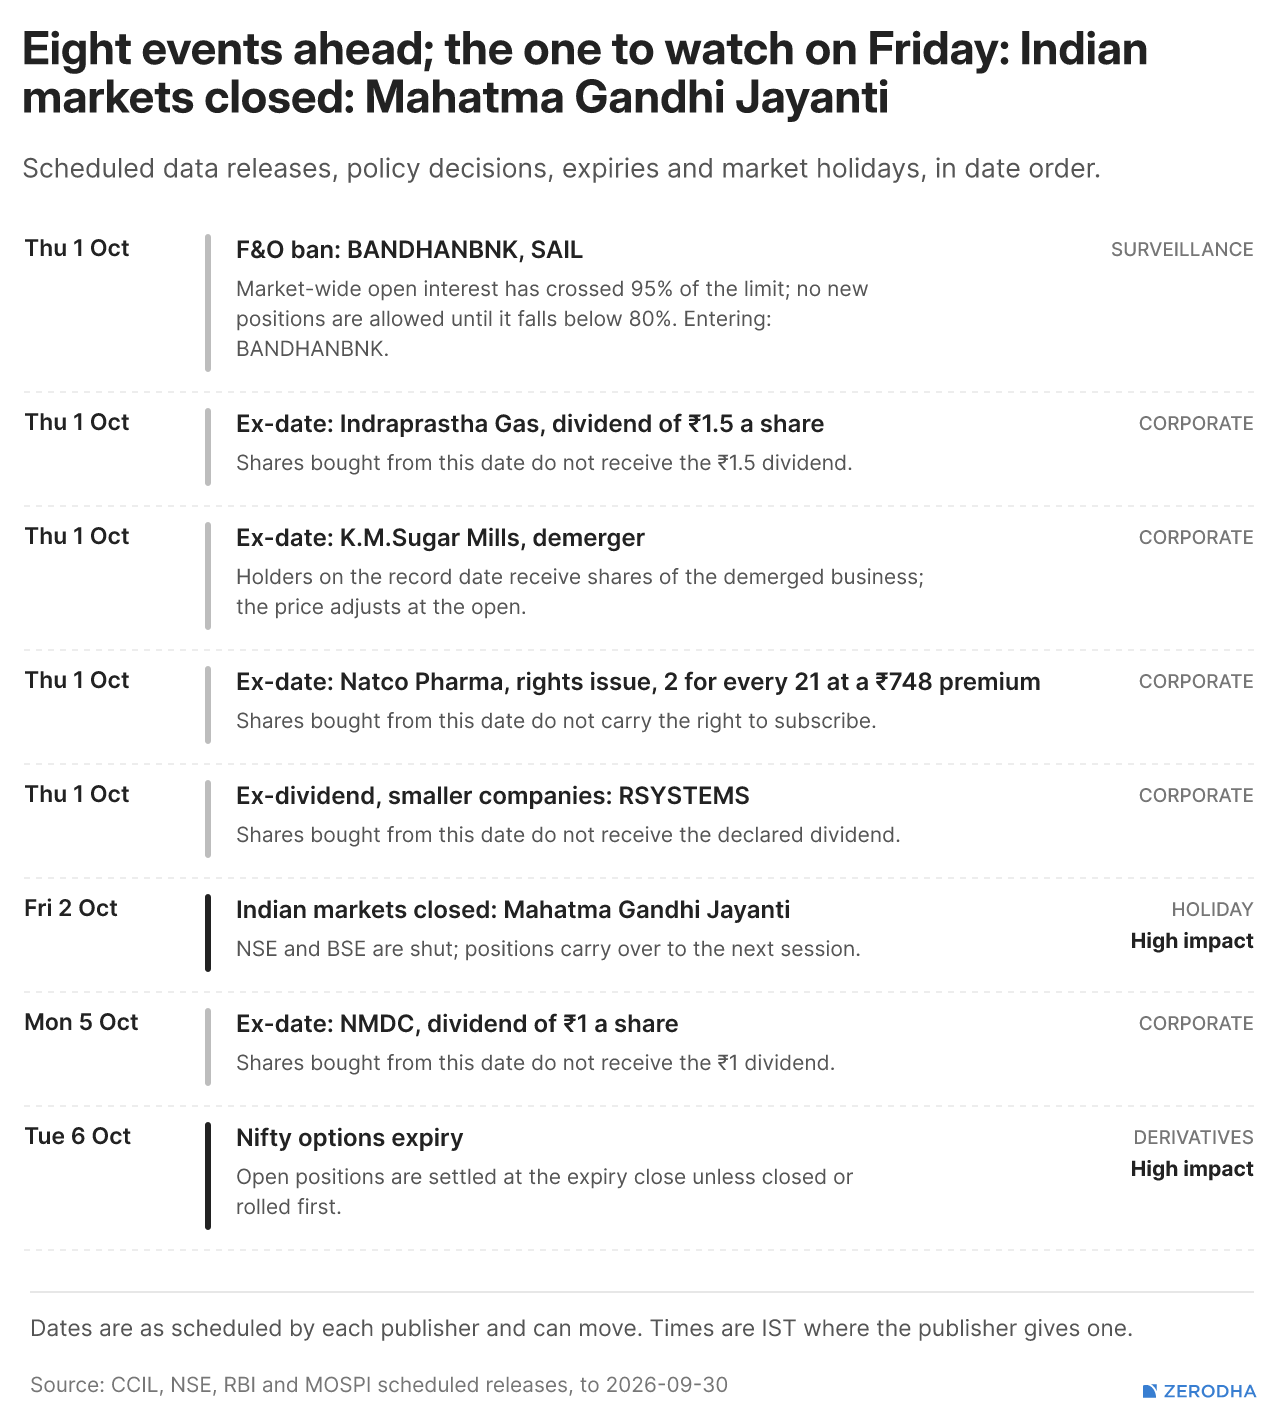
Corporate Actions
Published by Zerodha. Not investment advice. Data from NSE, BSE, and MCX.
In our latest episode of In The Money by Zerodha, we cover four major factors beyond momentum: Value, Quality, Low Volatility, and Size.
We look at how each factor is measured, the research behind them, and how they are represented through Indian market indices.
Finally, we compare how these factors have performed over a recent period, look at why different factors can behave differently, and discuss the difficult question of whether factors can actually be timed.
That’s it from us for today. We’d love to hear your feedback in the comments, and feel free to share this with your friends to spread the word!
The different charts now show levels which is very much useful and appreciated. Thanks!
Breadth and new highs/lows sit in separate blocks, but the useful read is how they move together over time. Only 21.5% of Nifty 500 above the 50-day, with lows beating highs 29 to 4, means more once it is ranked against its own trailing year. Same for the FII index-futures long share at 8.6%. A rolling percentile next to each raw level would help me most.