
Welcome to Aftermarket Report, a newsletter where we do a quick daily wrap-up of what happened in the markets, both in India and globally.
What data points and transformations do you want to see?
We’re trying out a new format for the Aftermarket Report, with much more comprehensive coverage of the data that shapes the trading day.
Beyond the headline indices, we’re now tracking market breadth, new highs and lows, sector and thematic performance, delivery data, F&O positioning, global markets, commodities, flows, and more. We’re also looking at ways to transform this raw data into insights that are actually useful for traders and investors.
The idea is simple: bring different datasets together in one place to give you a clearer picture of what’s happening beneath the surface of the market.
This is still a work in progress, and we’d love your feedback. What data points are we missing? What transformations, ratios, comparisons, or indicators would you find useful? Also tell us what worked, what didn’t, and what felt unnecessary.
Your feedback will help shape the Aftermarket Report from here.
Markets Today
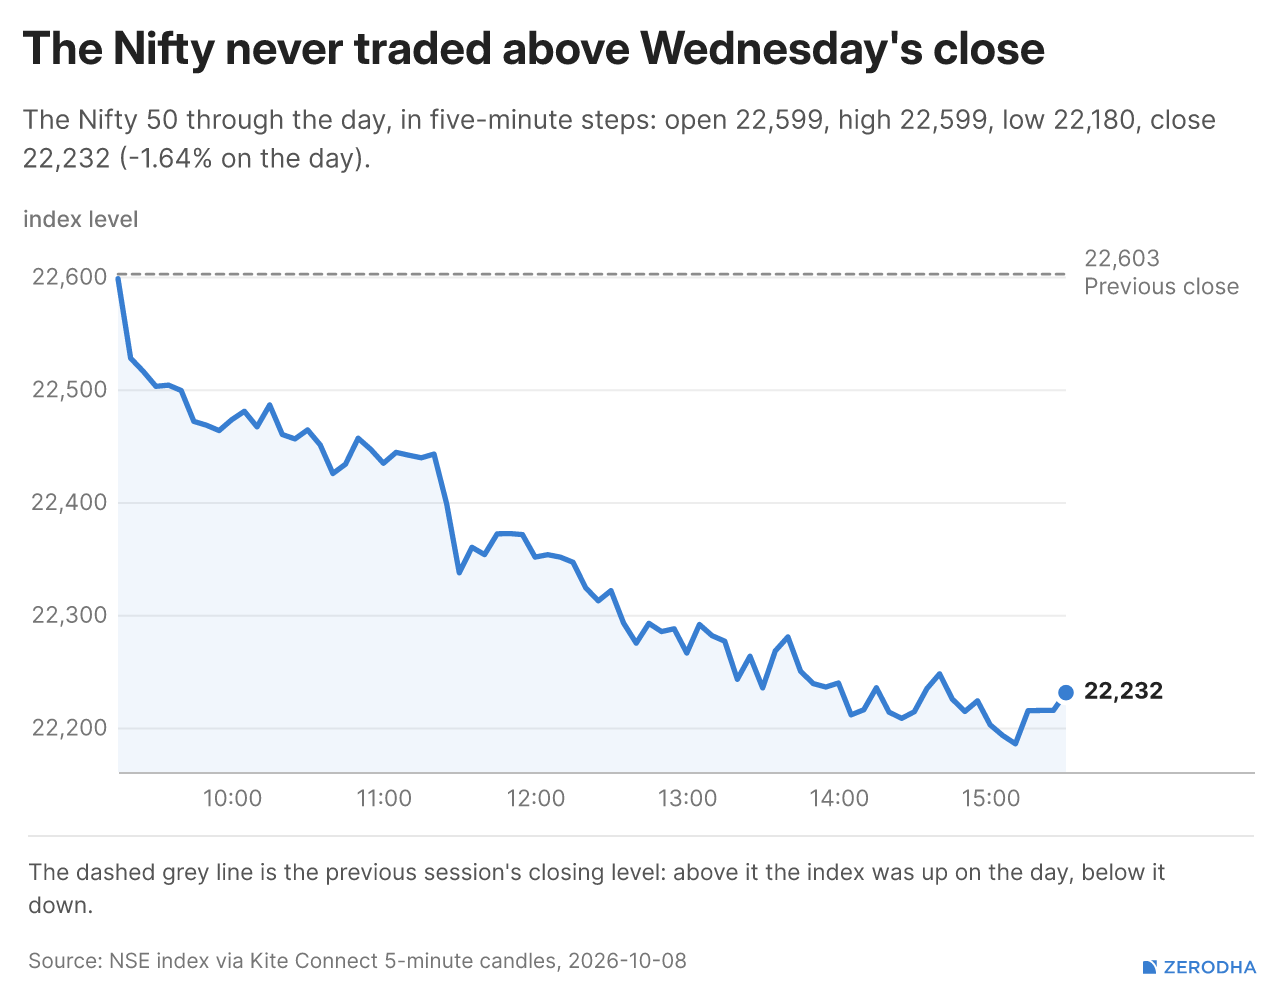
Nifty opened flat at 22,599, but immediately came under selling pressure amid weak global cues, surging oil prices on supply shortage concerns, and fragile domestic sentiment. The index slipped sharply below 22,550 within the opening minutes and continued to drift lower, falling towards 22,450 by 10 AM.
A brief recovery attempt failed to sustain, with Nifty largely oscillating between 22,430 and 22,450 through the rest of the morning. Selling intensified around 11:15 AM, dragging the index below 22,400 and eventually towards 22,350 by noon.
Weakness persisted into the second half, with Nifty steadily slipping below 22,300 around 12:30 PM. Despite occasional recovery attempts, selling pressure remained dominant, pushing the index towards 22,250 by 1:30 PM. The decline slowed after 2 PM, with Nifty consolidating largely between 22,200 and 22,250 through the final hour.
A fresh bout of selling briefly dragged the index below 22,200 to 22,180 around 3 PM before a modest recovery in the closing minutes. Nifty eventually closed at 22,231.80, nearly 370 points below its opening level, marking another weak session as persistent selling pressure and rising global risks continued to weigh on sentiment.
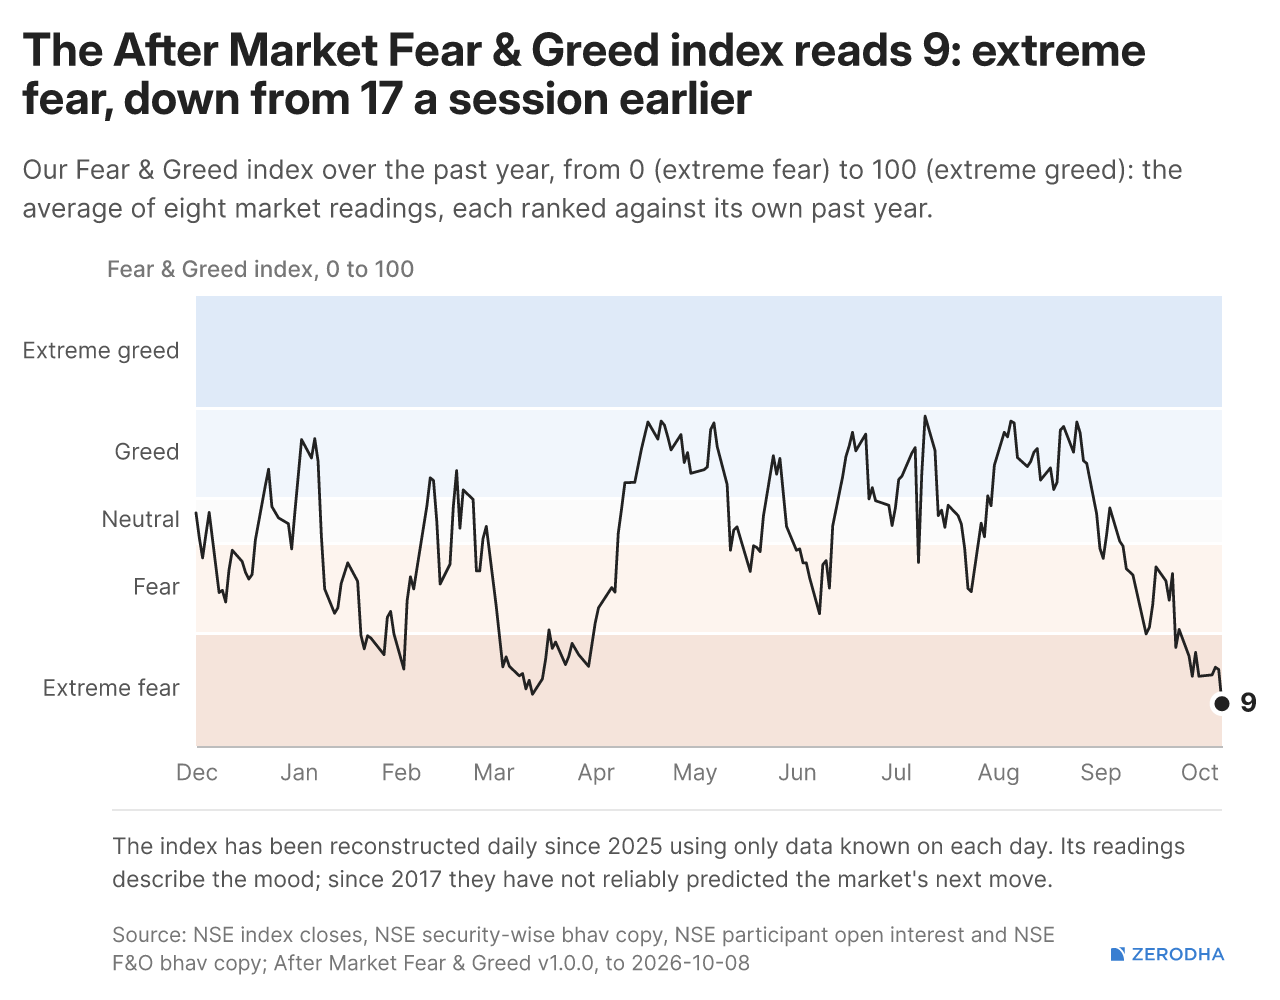
Fear & Greed Index
The Fear & Greed Index plunged from 17 to 9, remaining deep in extreme fear. Weak market trends, bonds outperforming equities, and defensive stocks outperforming high-beta stocks reflect deteriorating risk appetite.
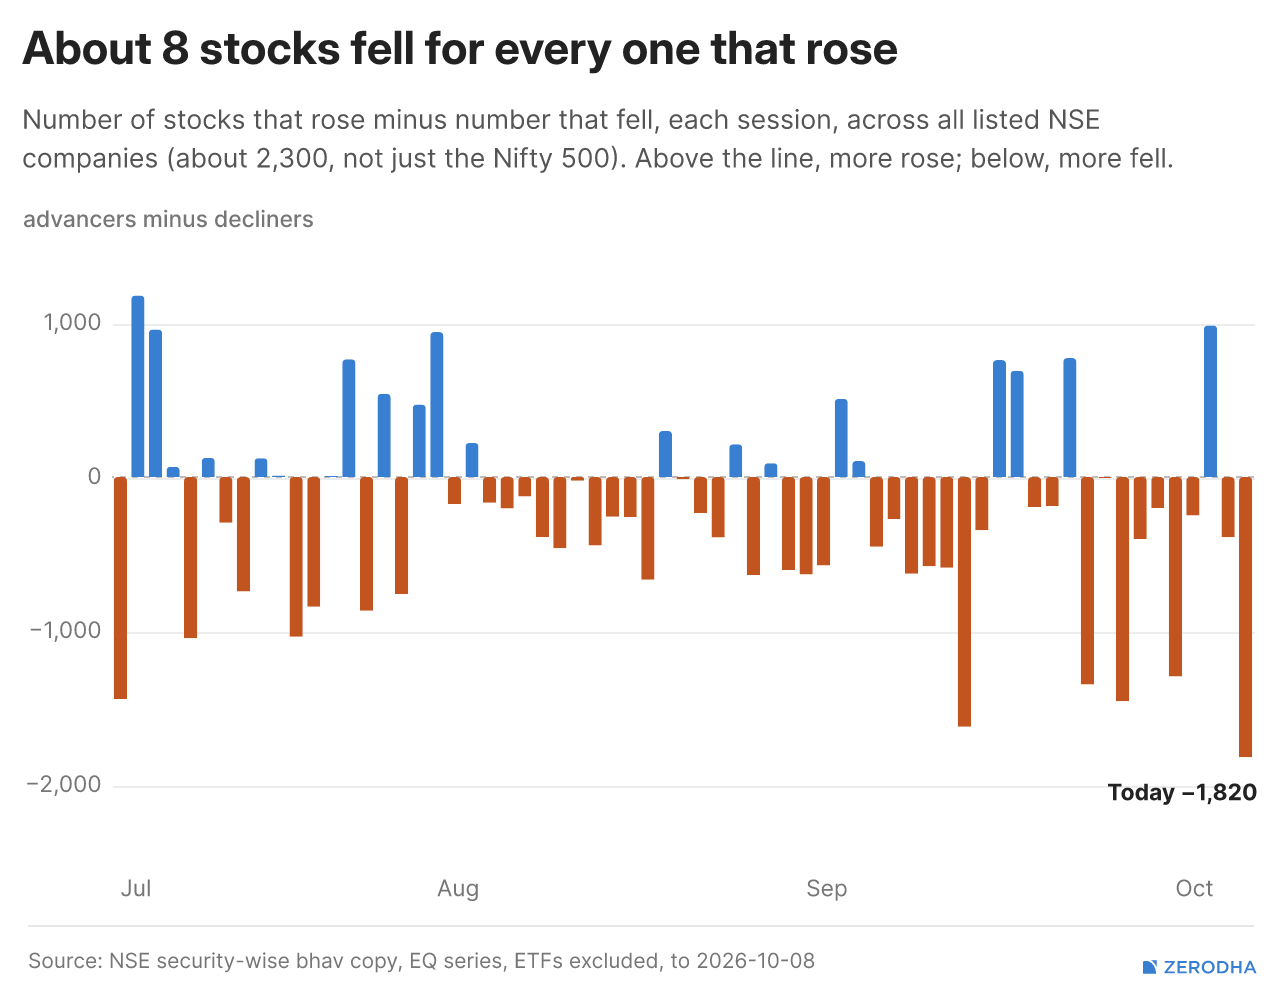
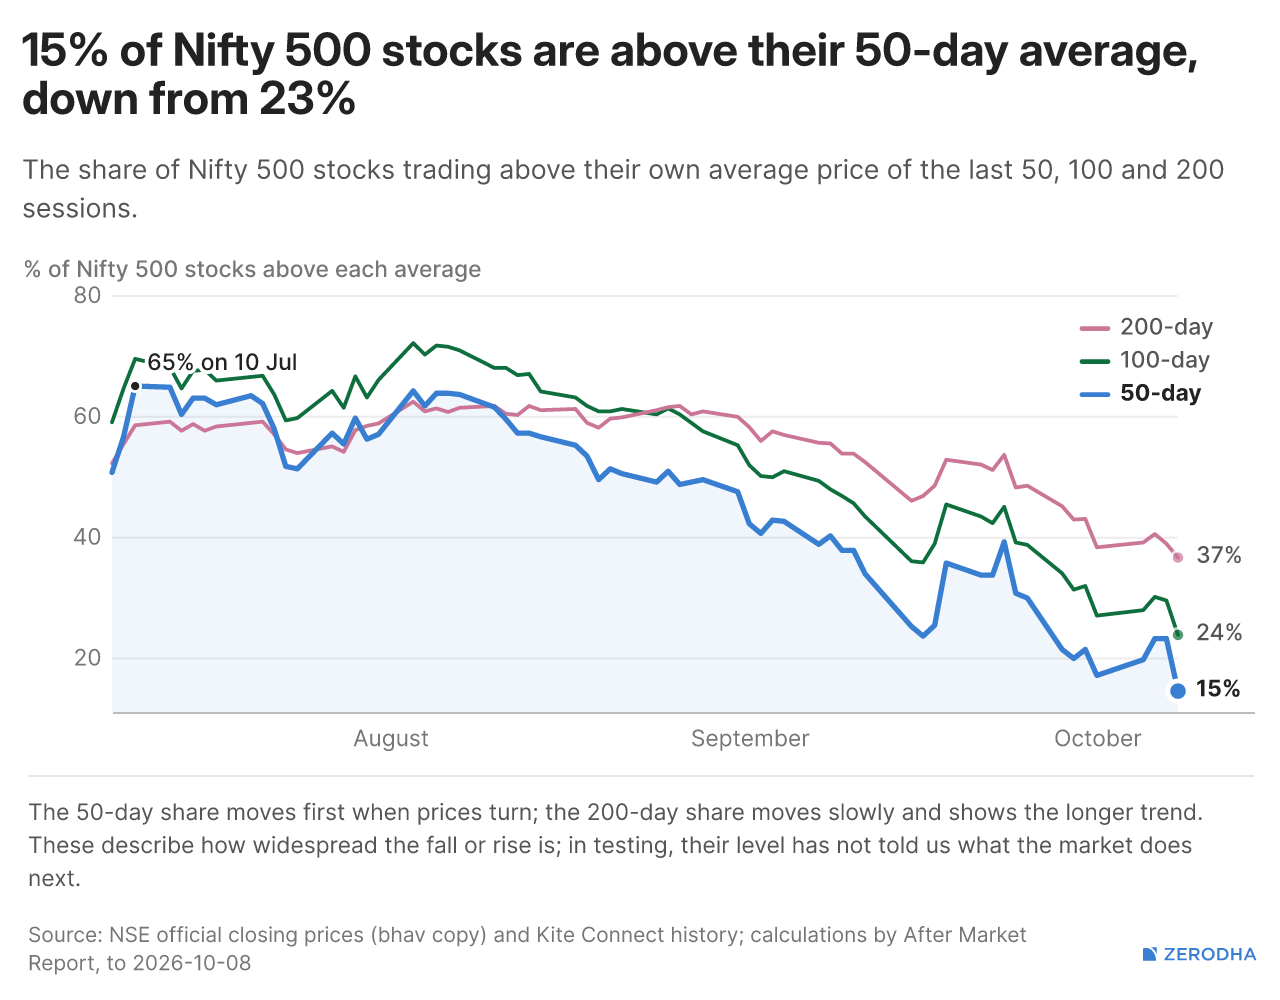
Market Breadth
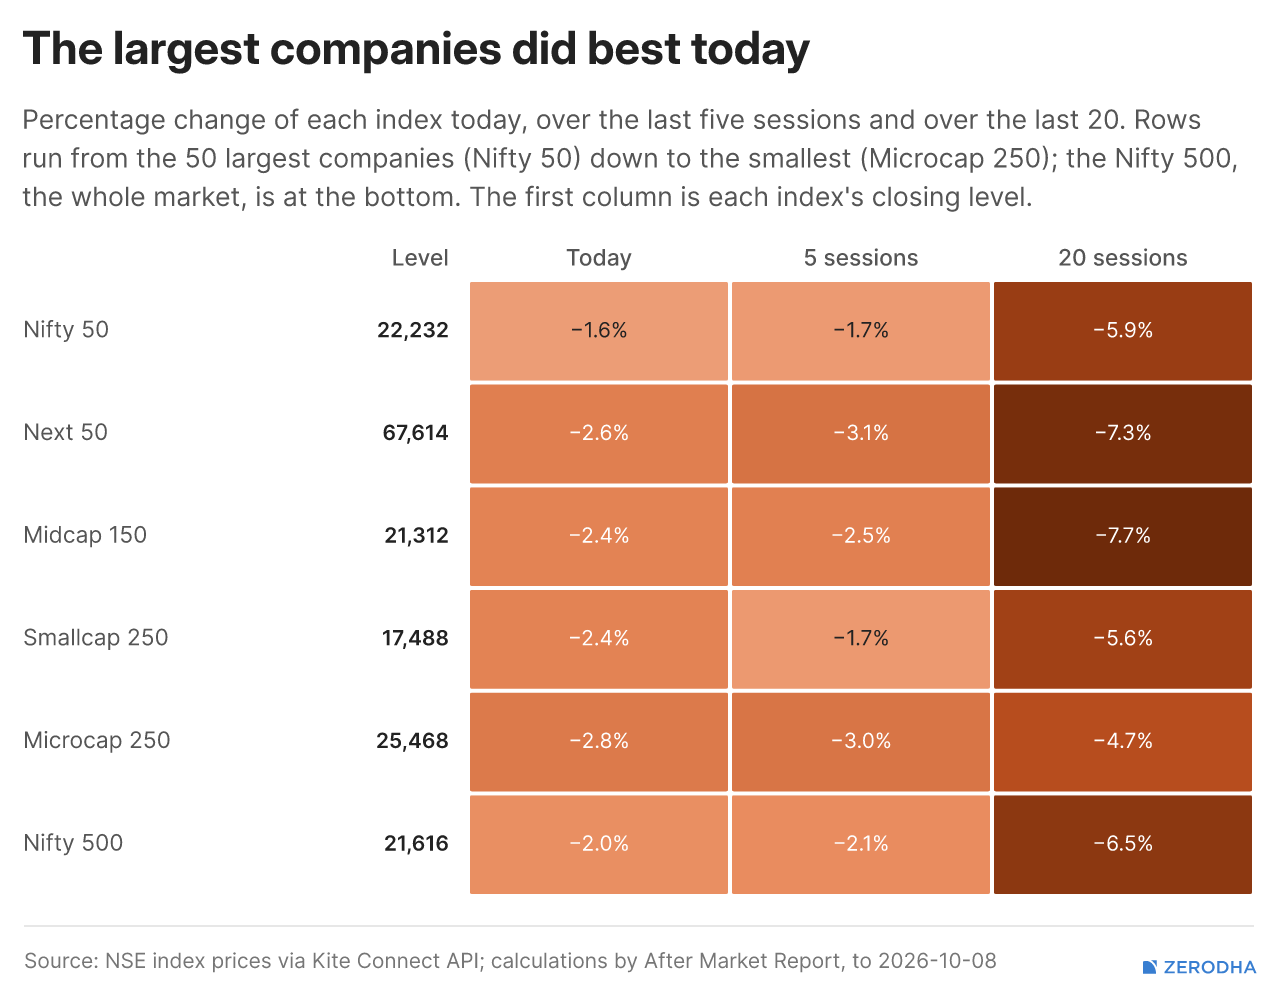
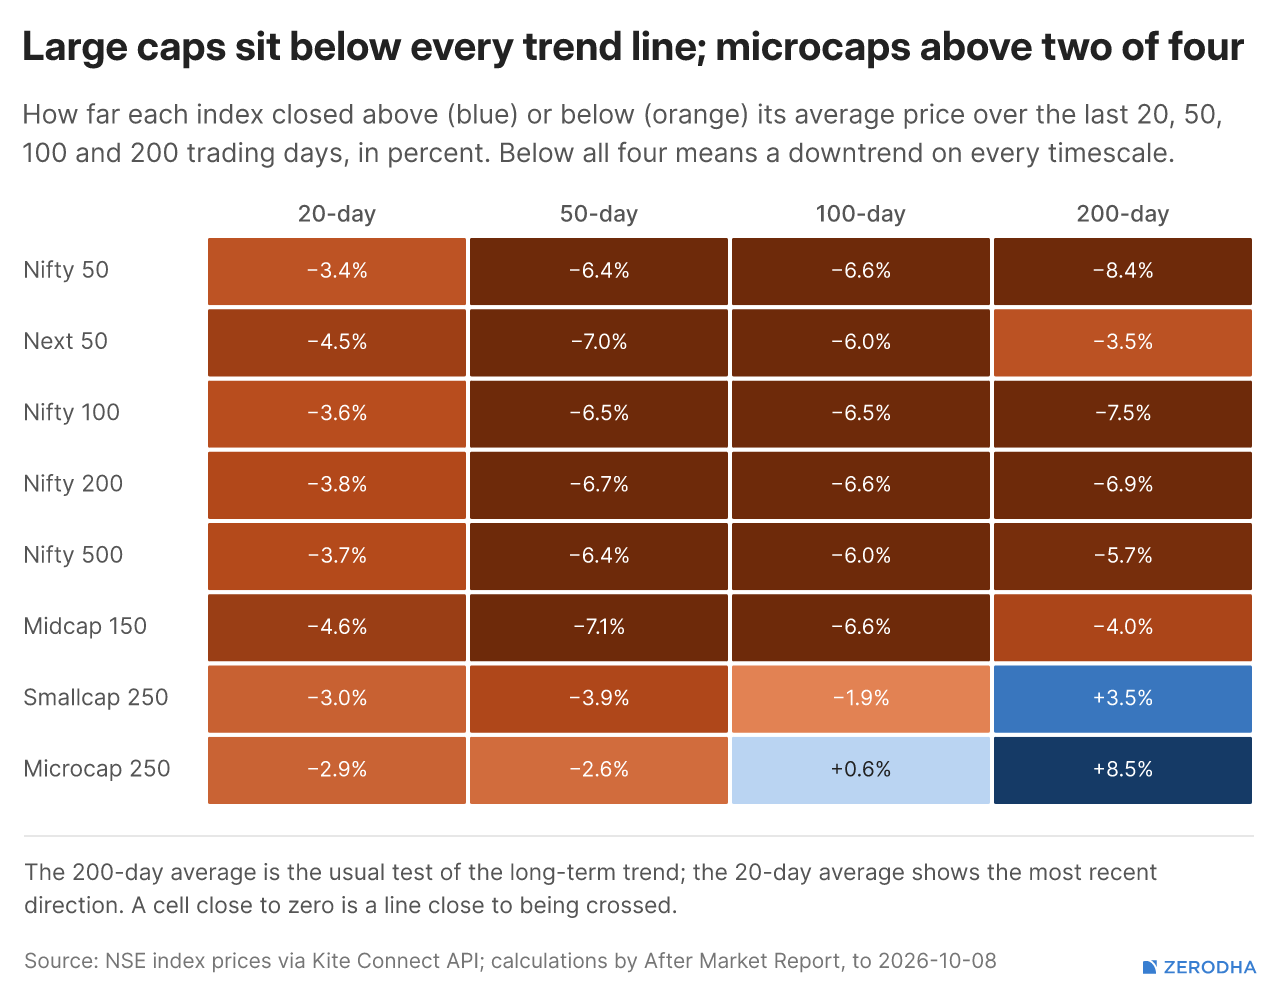
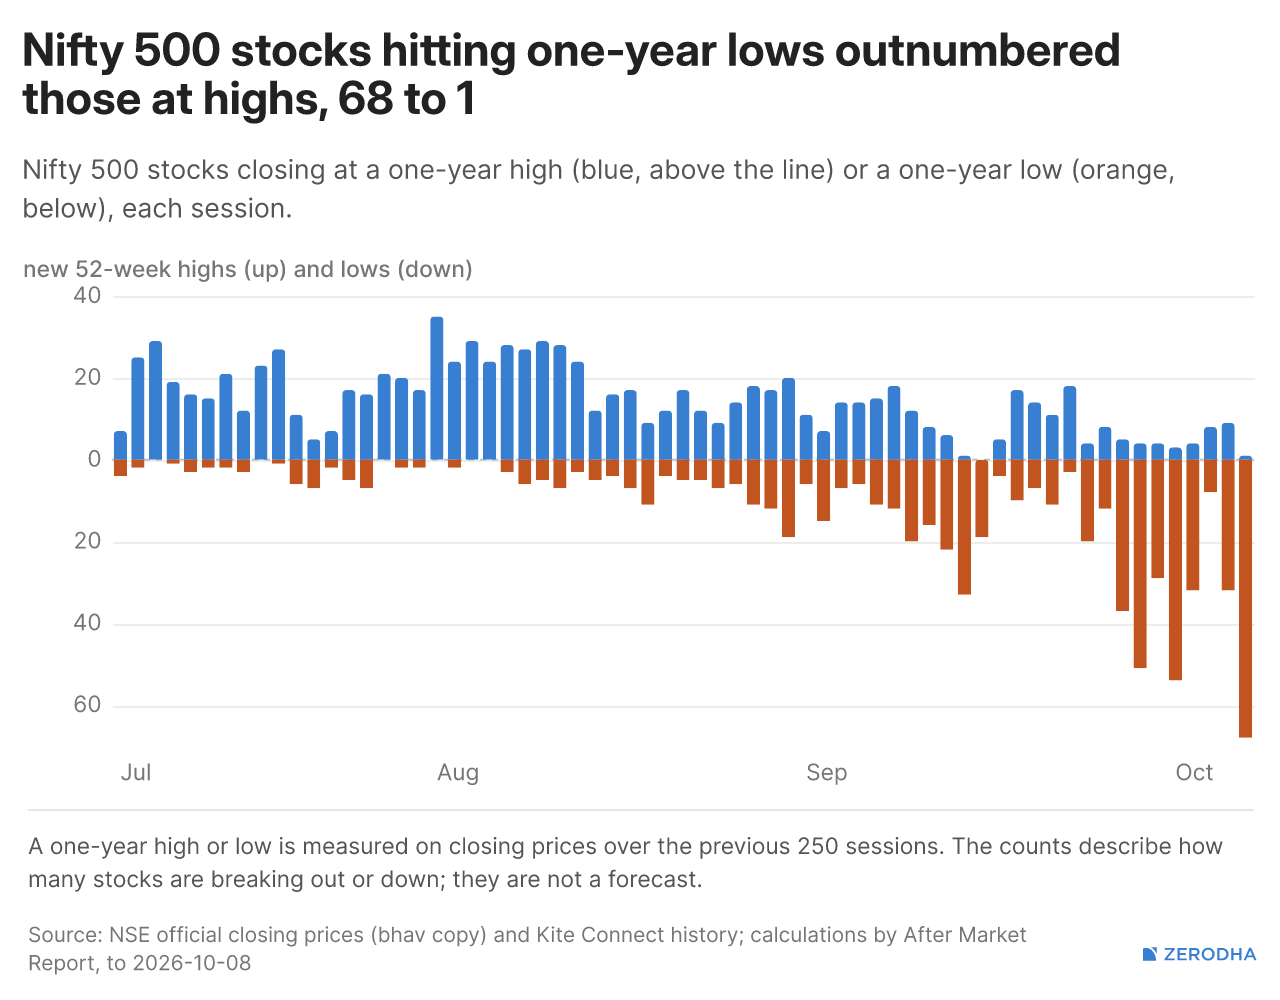
Selling was widespread, with 2,068 decliners against just 248 advancers, while only 14.6% of Nifty 500 stocks remain above their 50-day average. New 52-week lows overwhelmed highs by 68 to 1, highlighting severe underlying weakness.
52 Week Highs & Lows
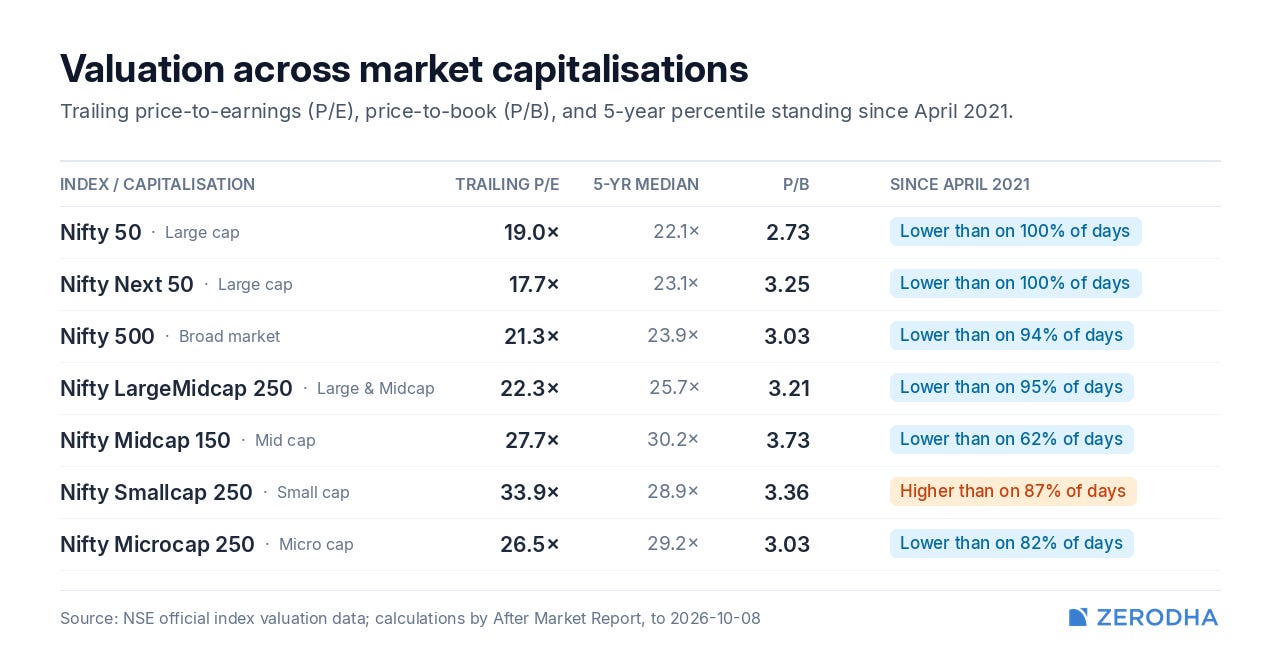
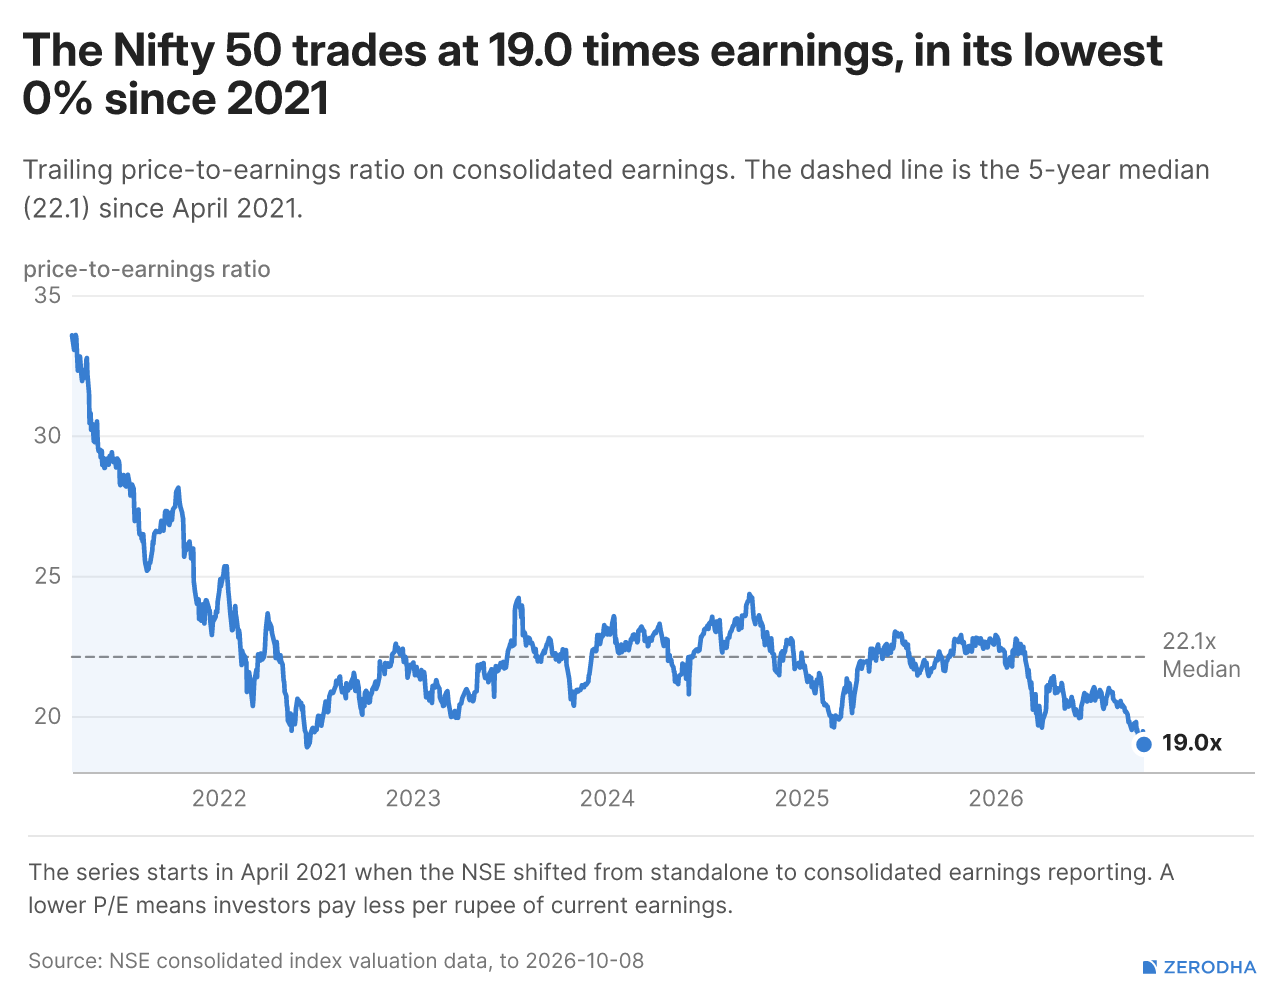
Valuation Check
Sectoral Indices Performance
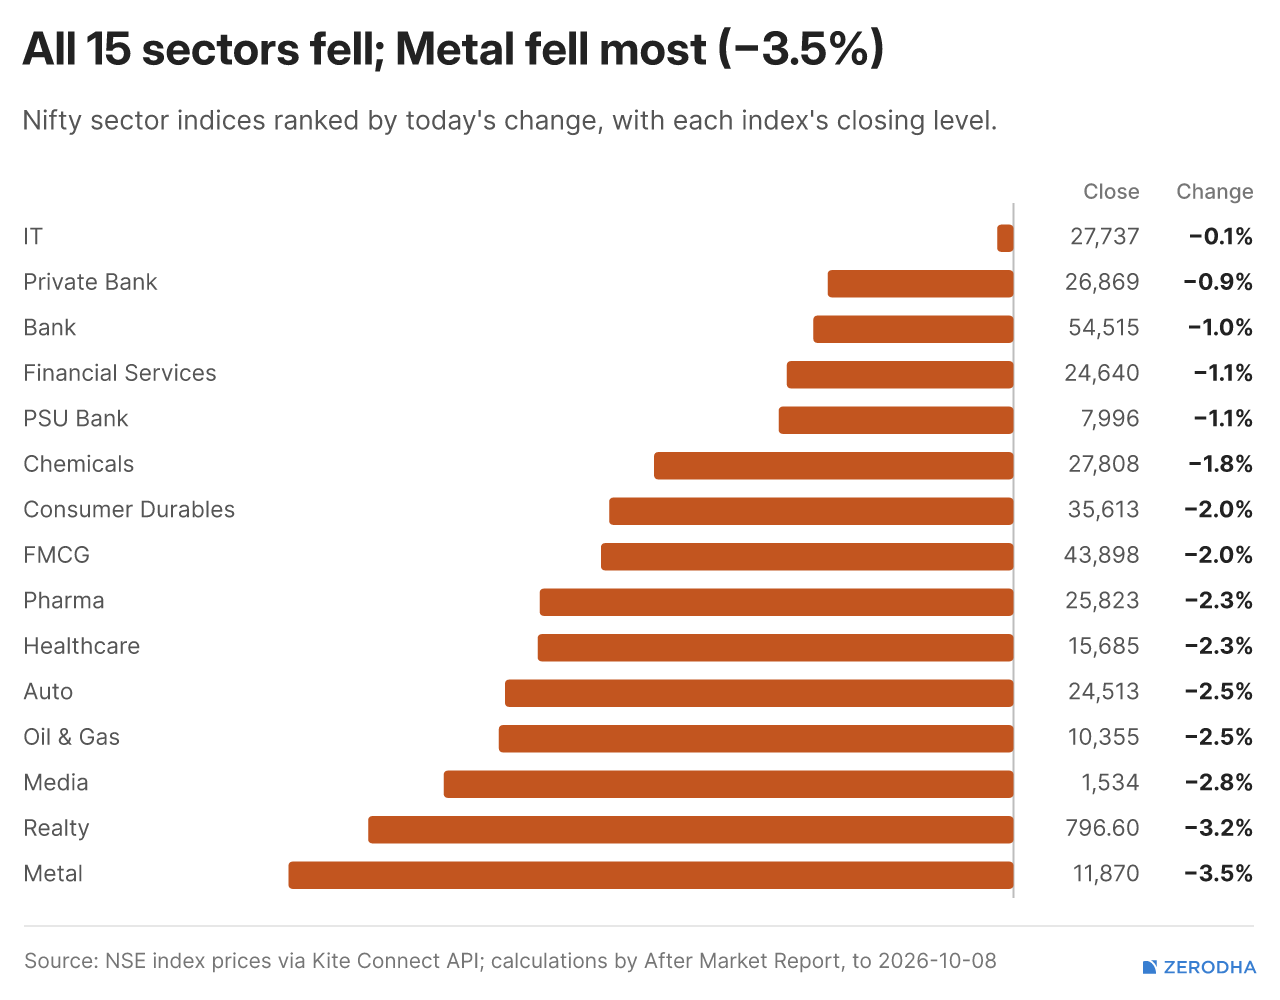
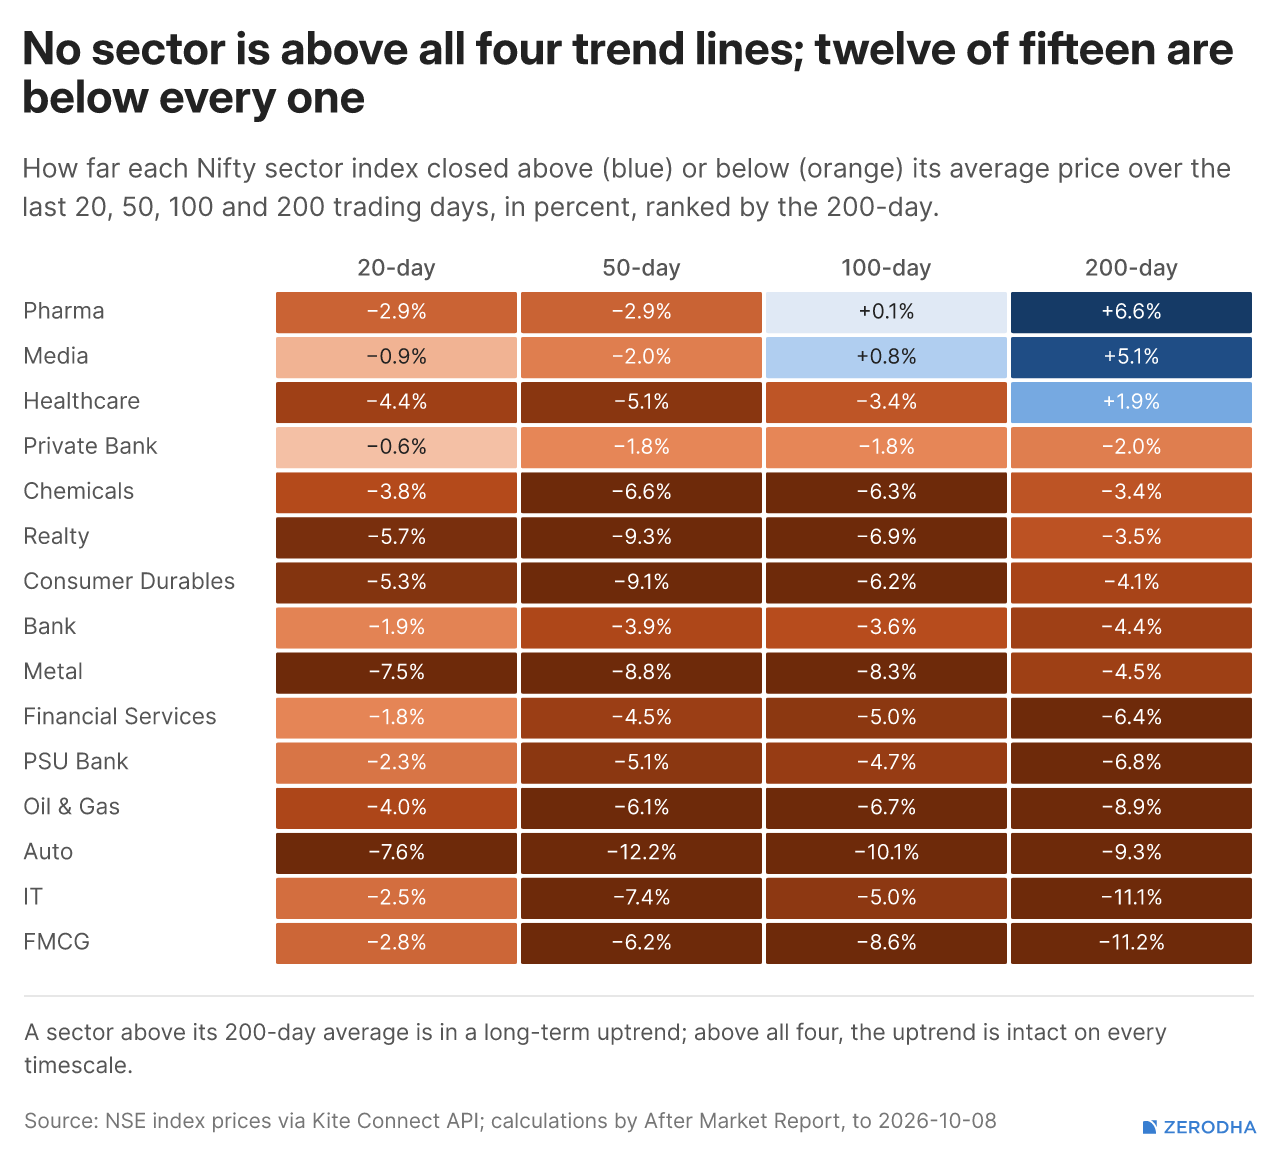
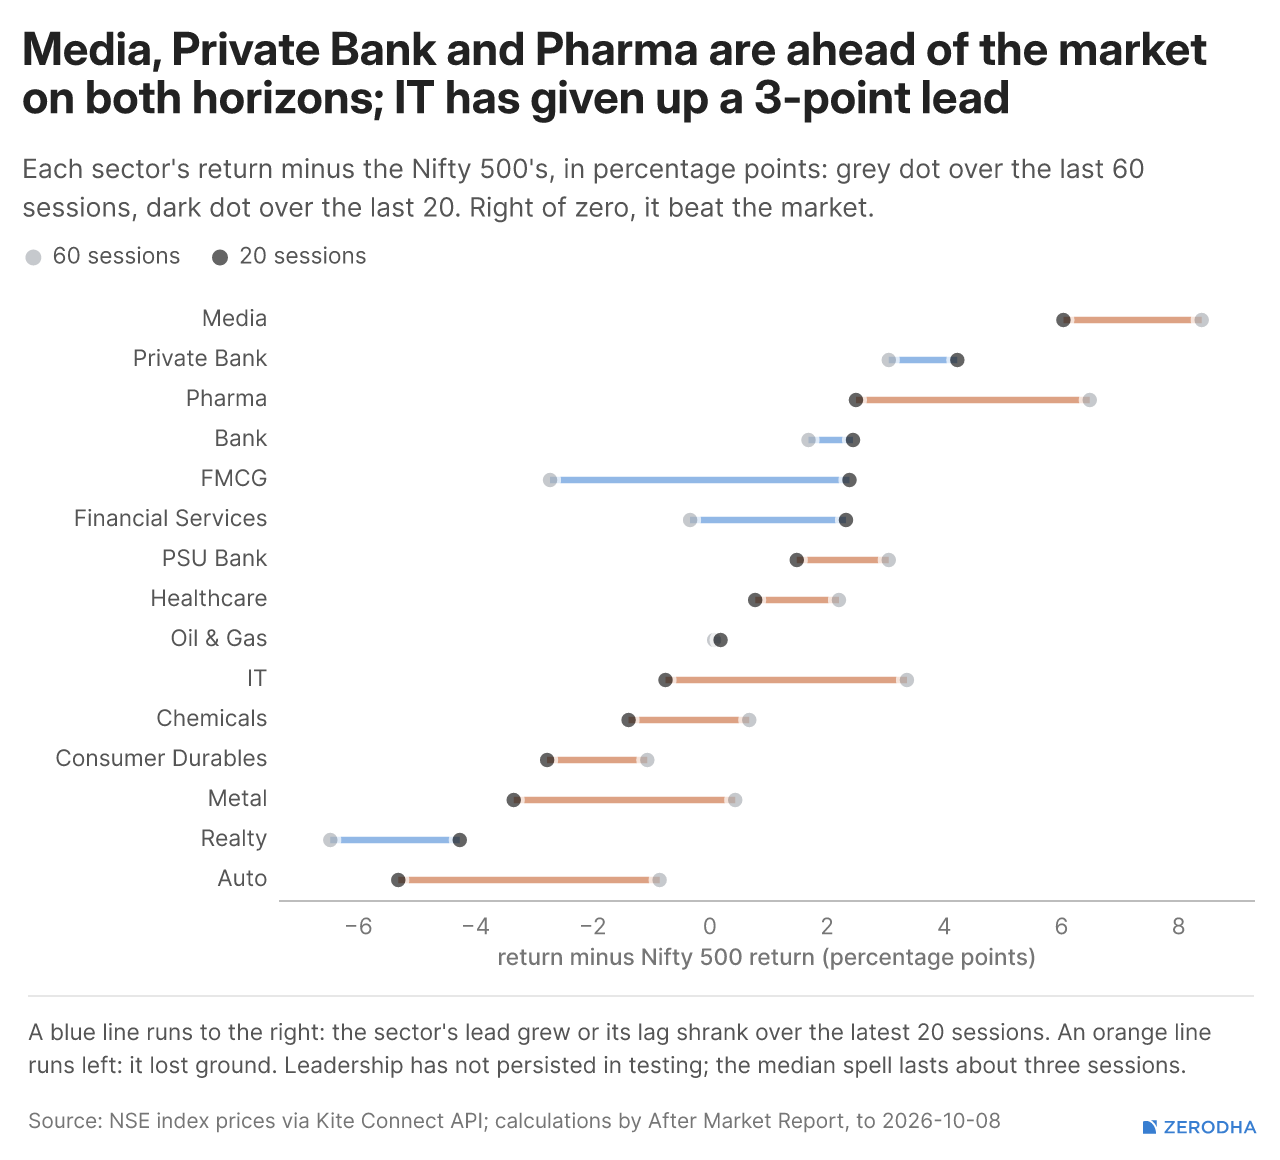
All 15 sectors ended lower, with IT holding up best (-0.08%) and Metals falling the most (-3.55%). Media, Private Banks and Pharma remain the relative leaders over 20 and 60 sessions, but no sector is now above all four key moving averages.
Winners & Losers
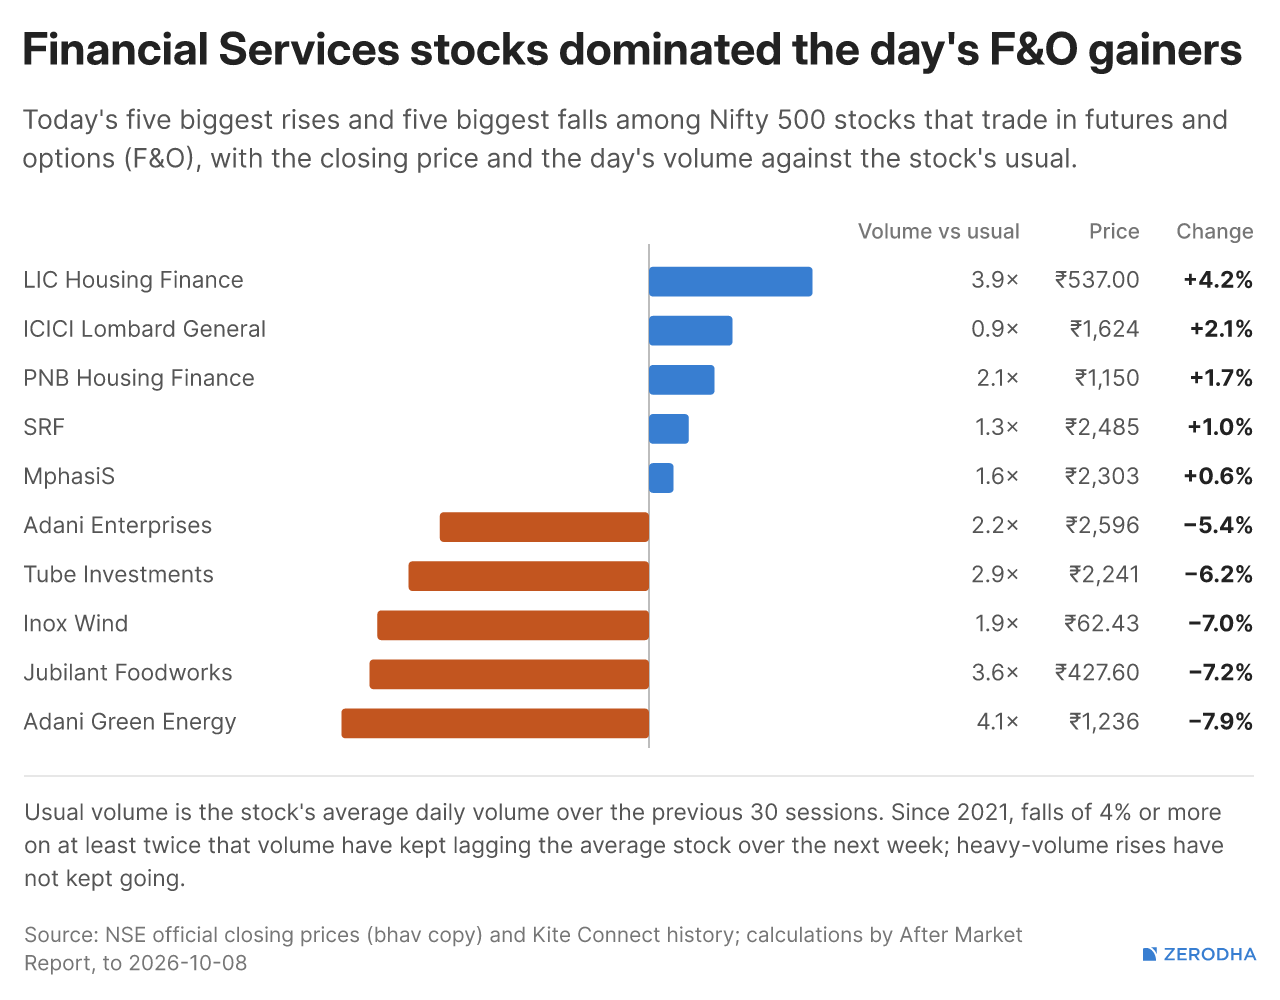
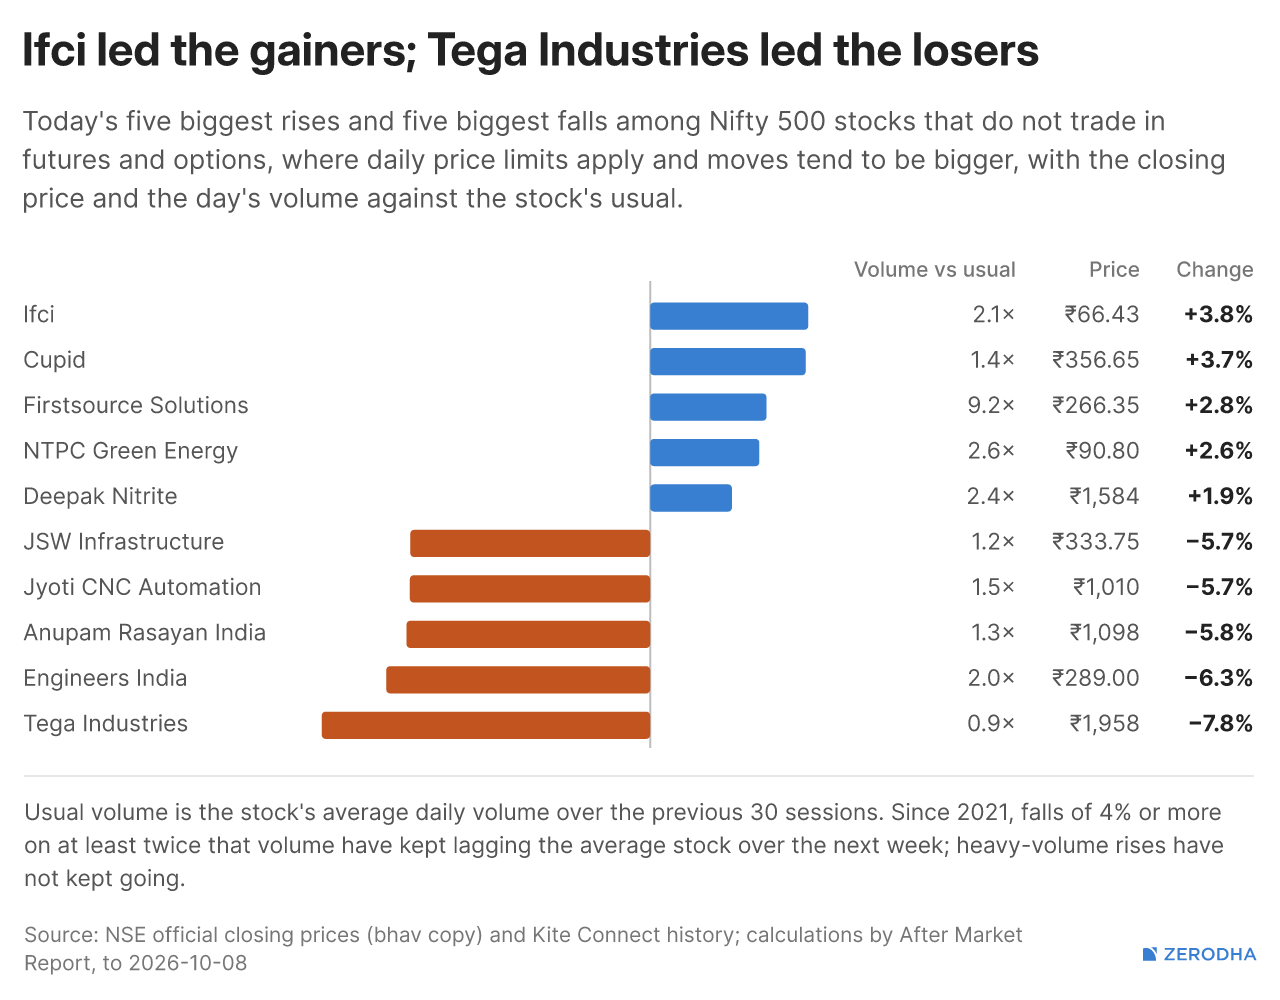
Adani Green Energy plunged 7.88% on 4.1× usual volume, while Jubilant Foodworks fell 7.16% on heavy trading. Vodafone Idea saw the biggest jump in implied volatility, rising 6 points to 47.5%, while Cupid was among the few stocks hitting a 52-week high.
Delivery Data
Global Markets
Commodities
Institutional Flows & Participant Positioning
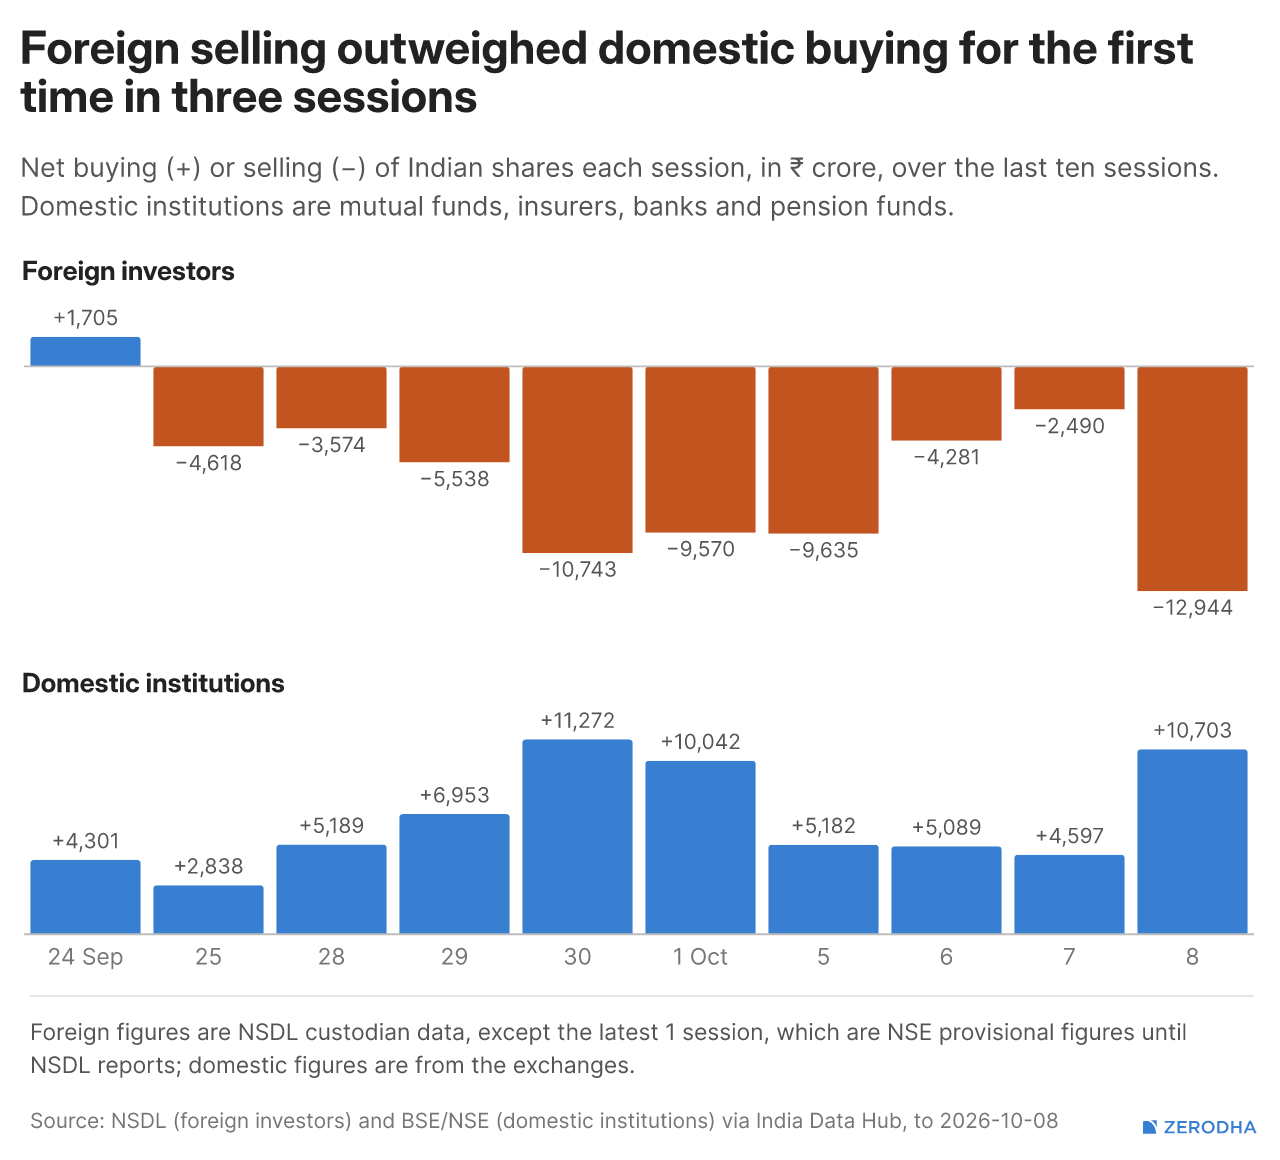
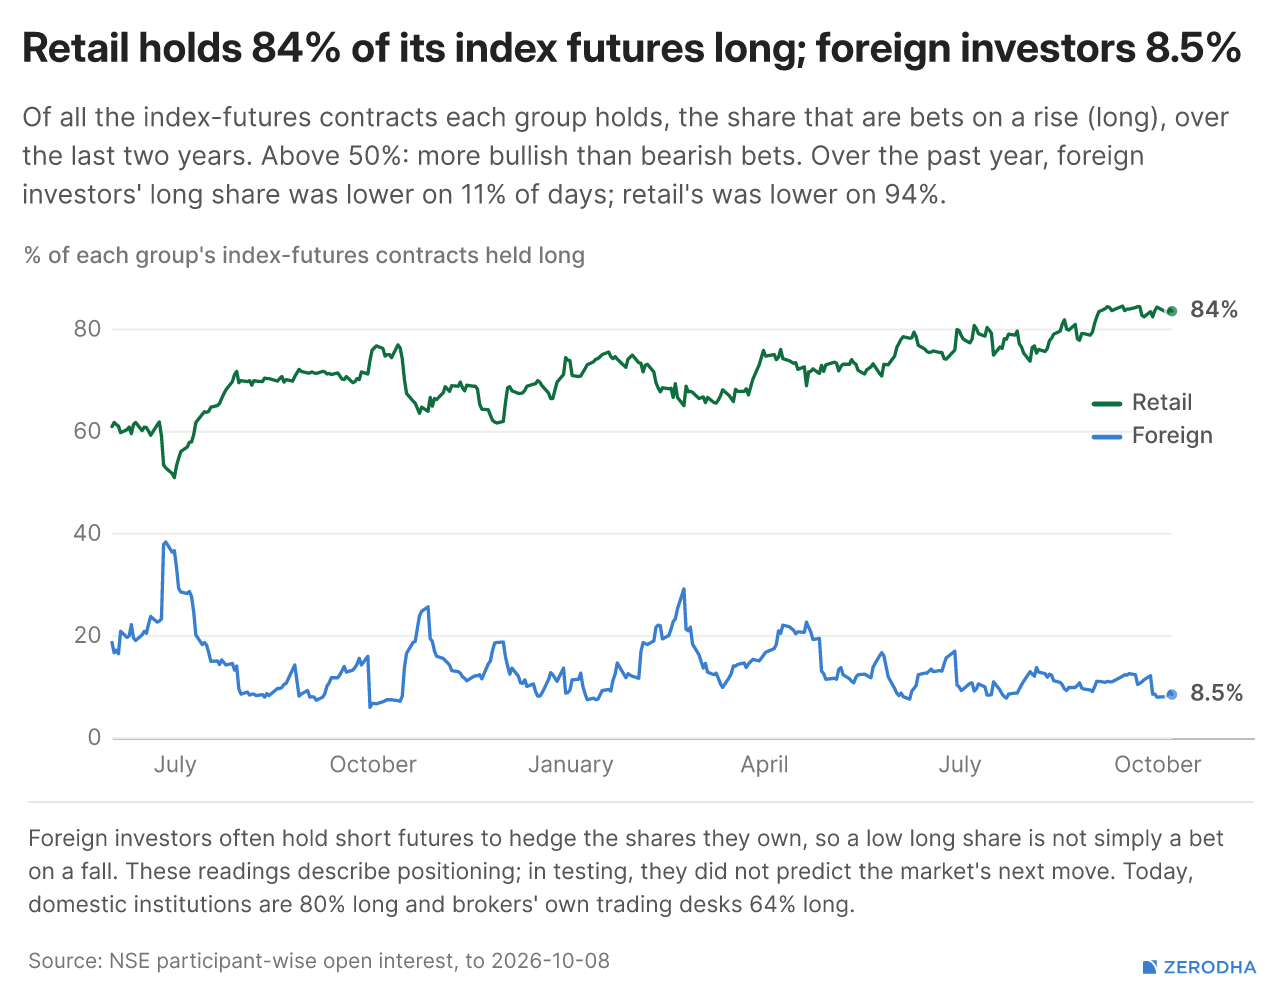
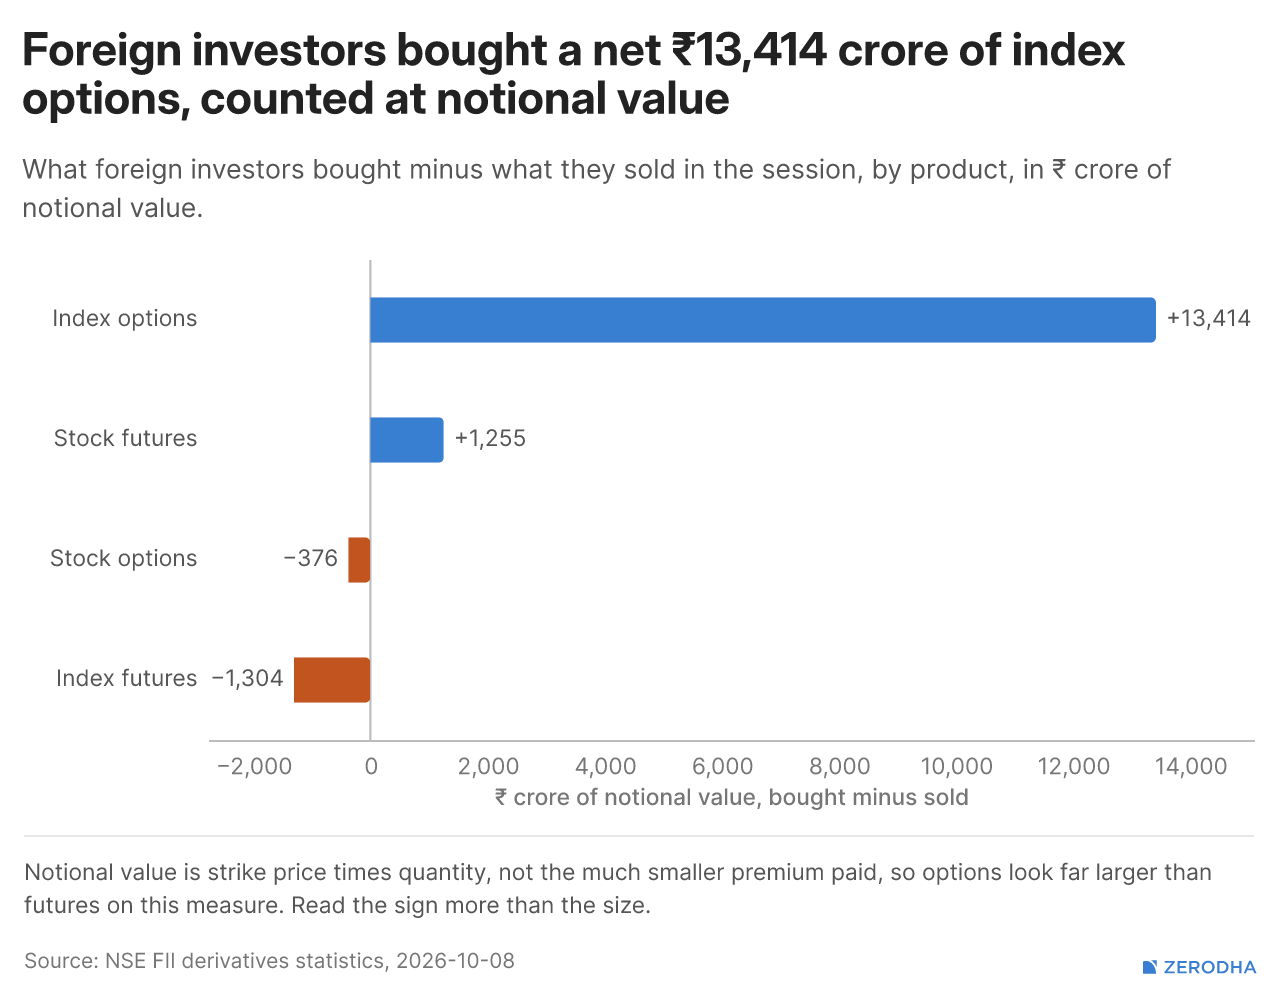
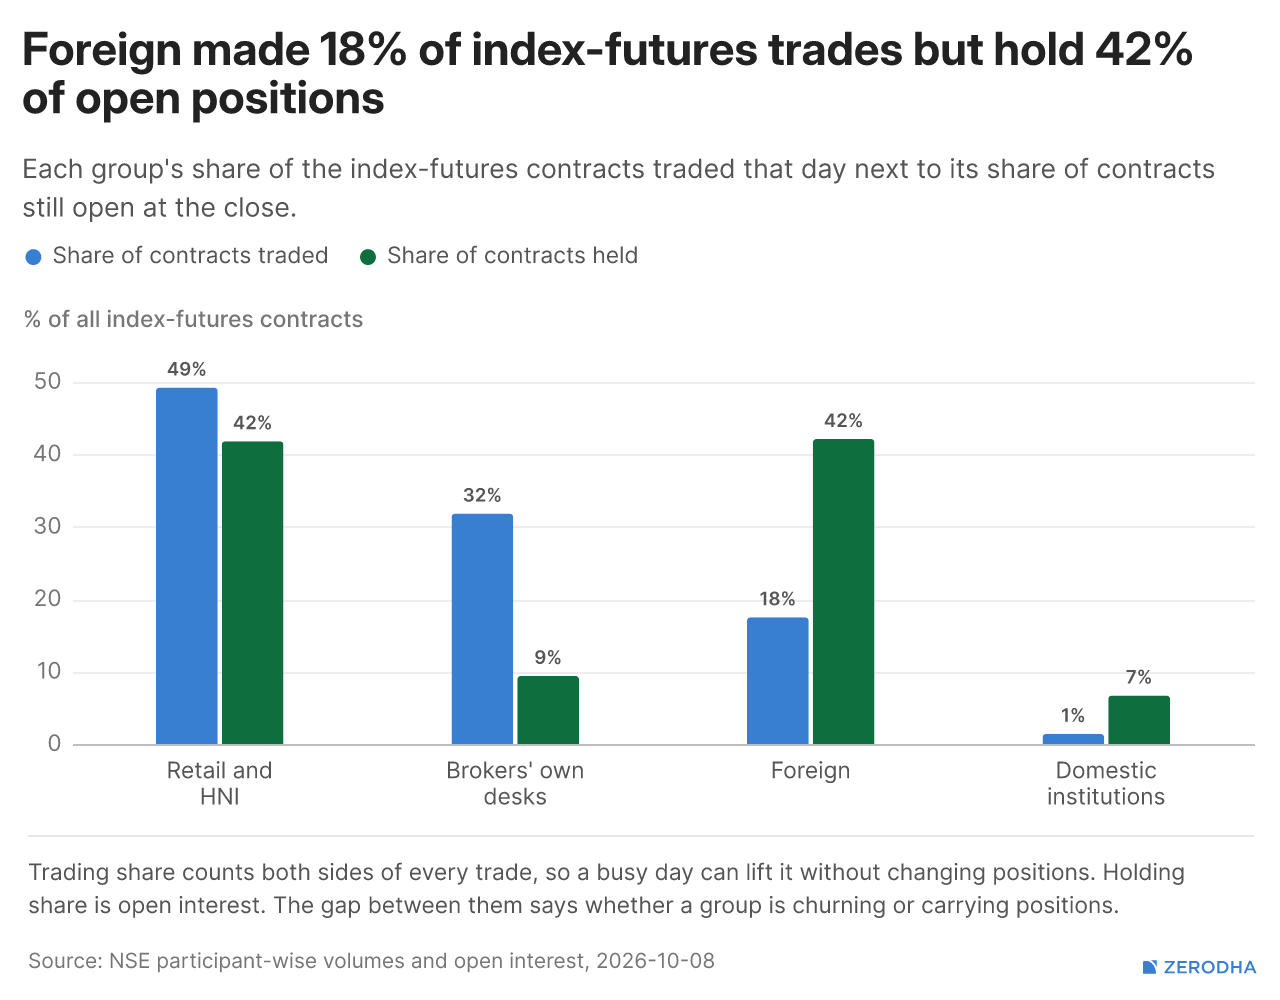
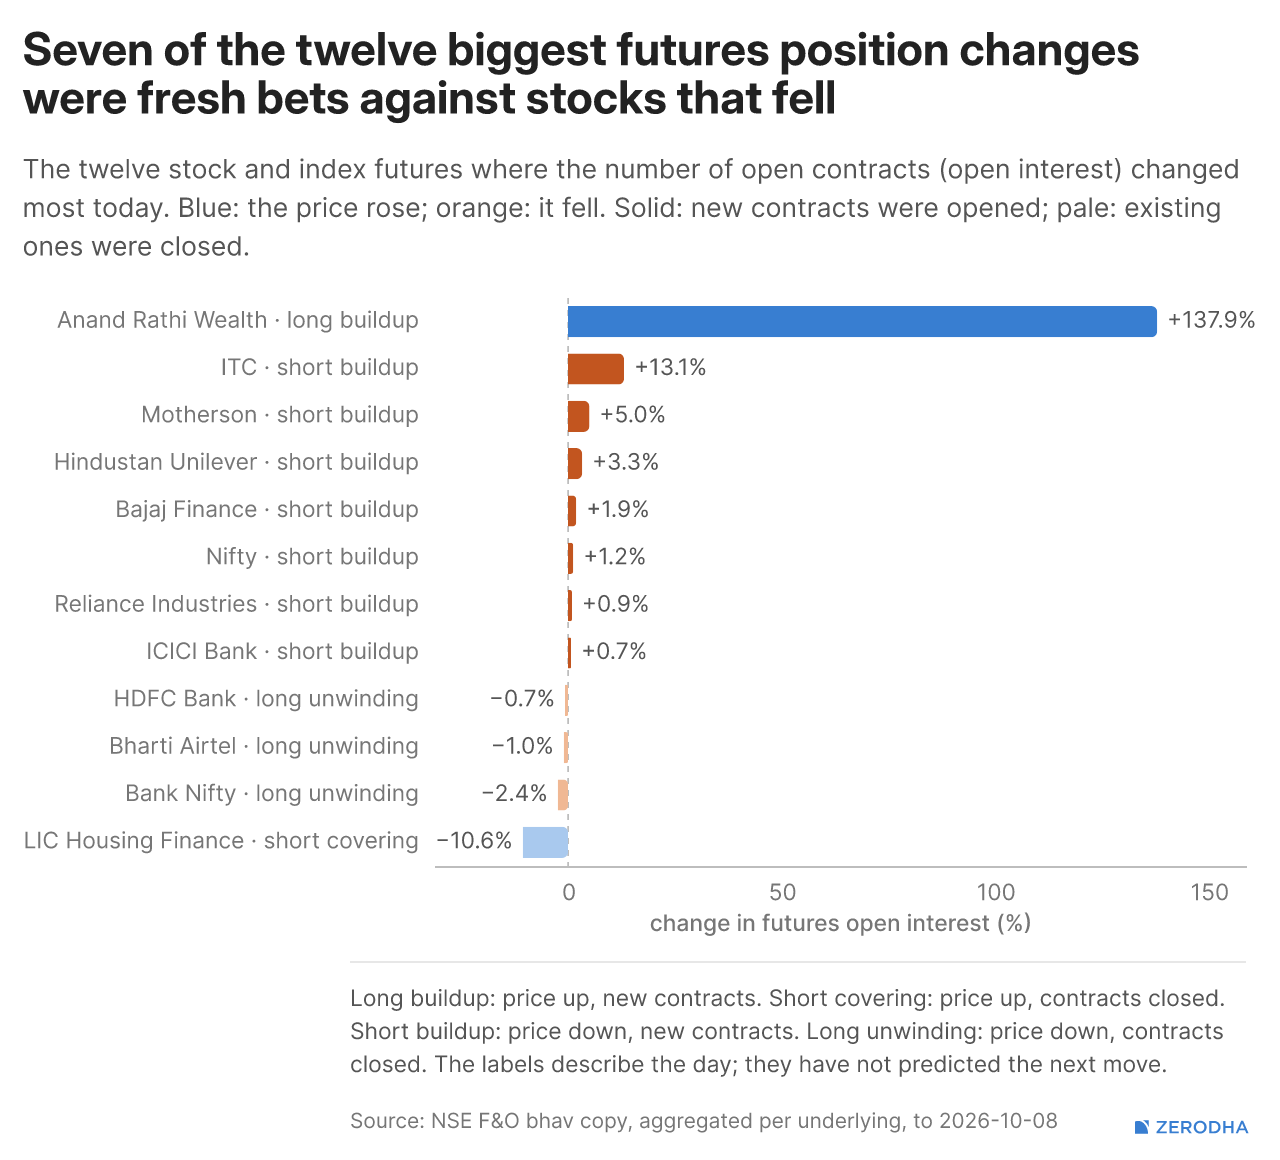
Call writing intensified, pushing the PCR down from 0.89 to 0.73, while implied volatility rose from 11.9% to 13.5%. FIIs remain heavily bearish with just 8.5% of index-futures positions long, while retail and HNIs are 84% long; seven of the 12 largest stock-futures OI moves were short buildups.
Thematic Indices
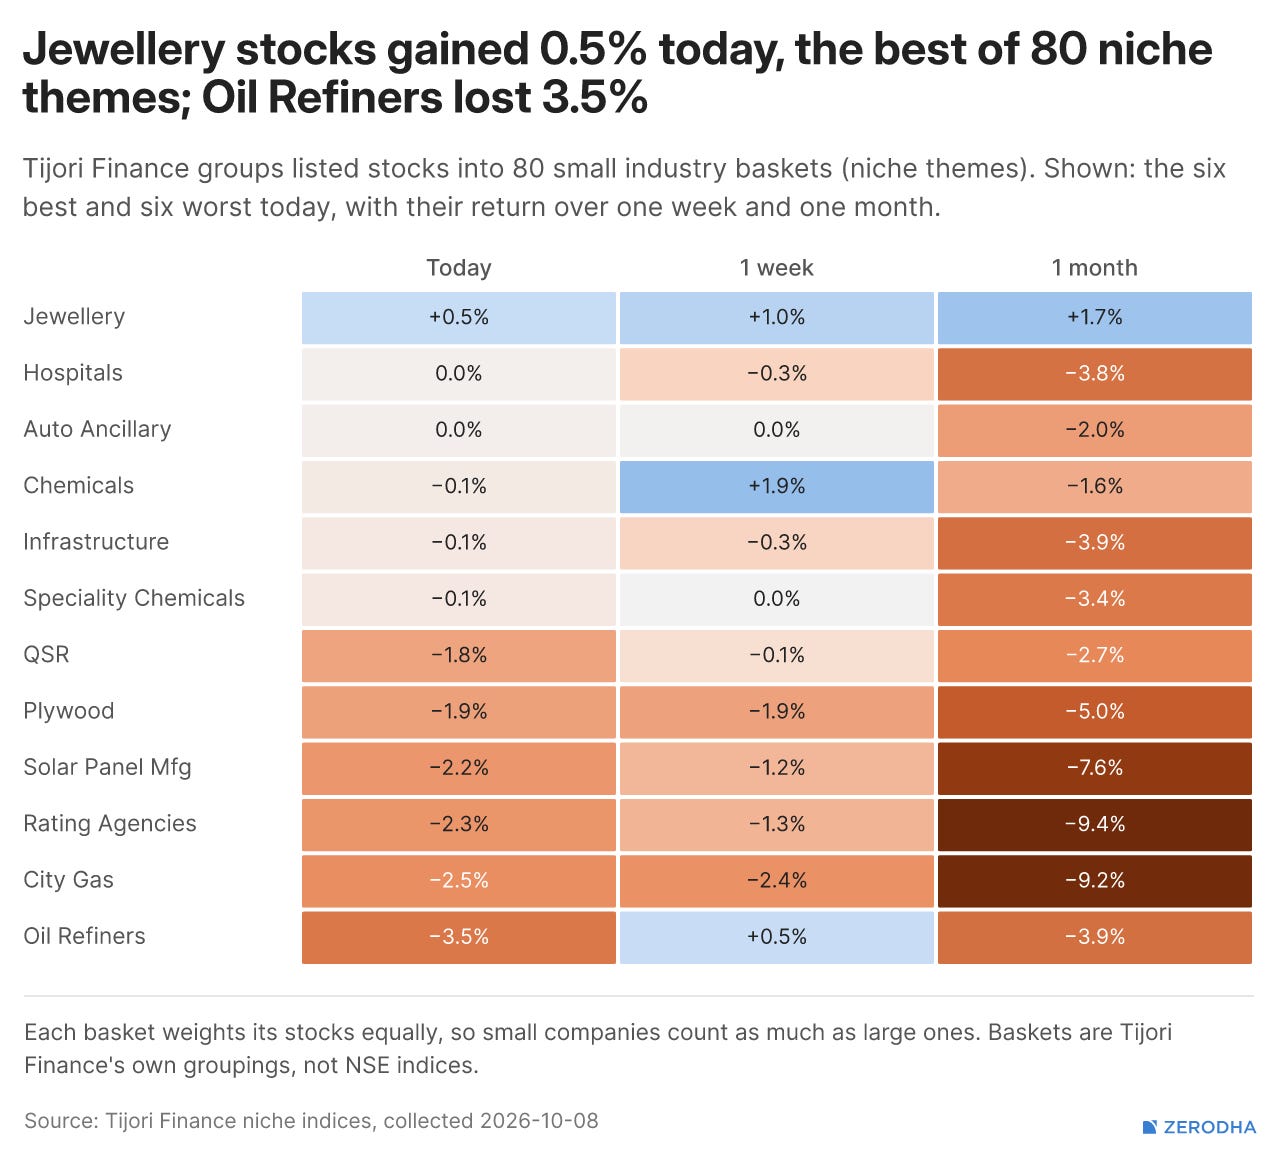
Tijori’s niche indices, where today’s move sorts pockets of the market beyond standard sector baskets. You can also track promoter buying and other interesting stuff, like Capex activity by the companies in the Tijori App’s idea dashboard
F&O Corner
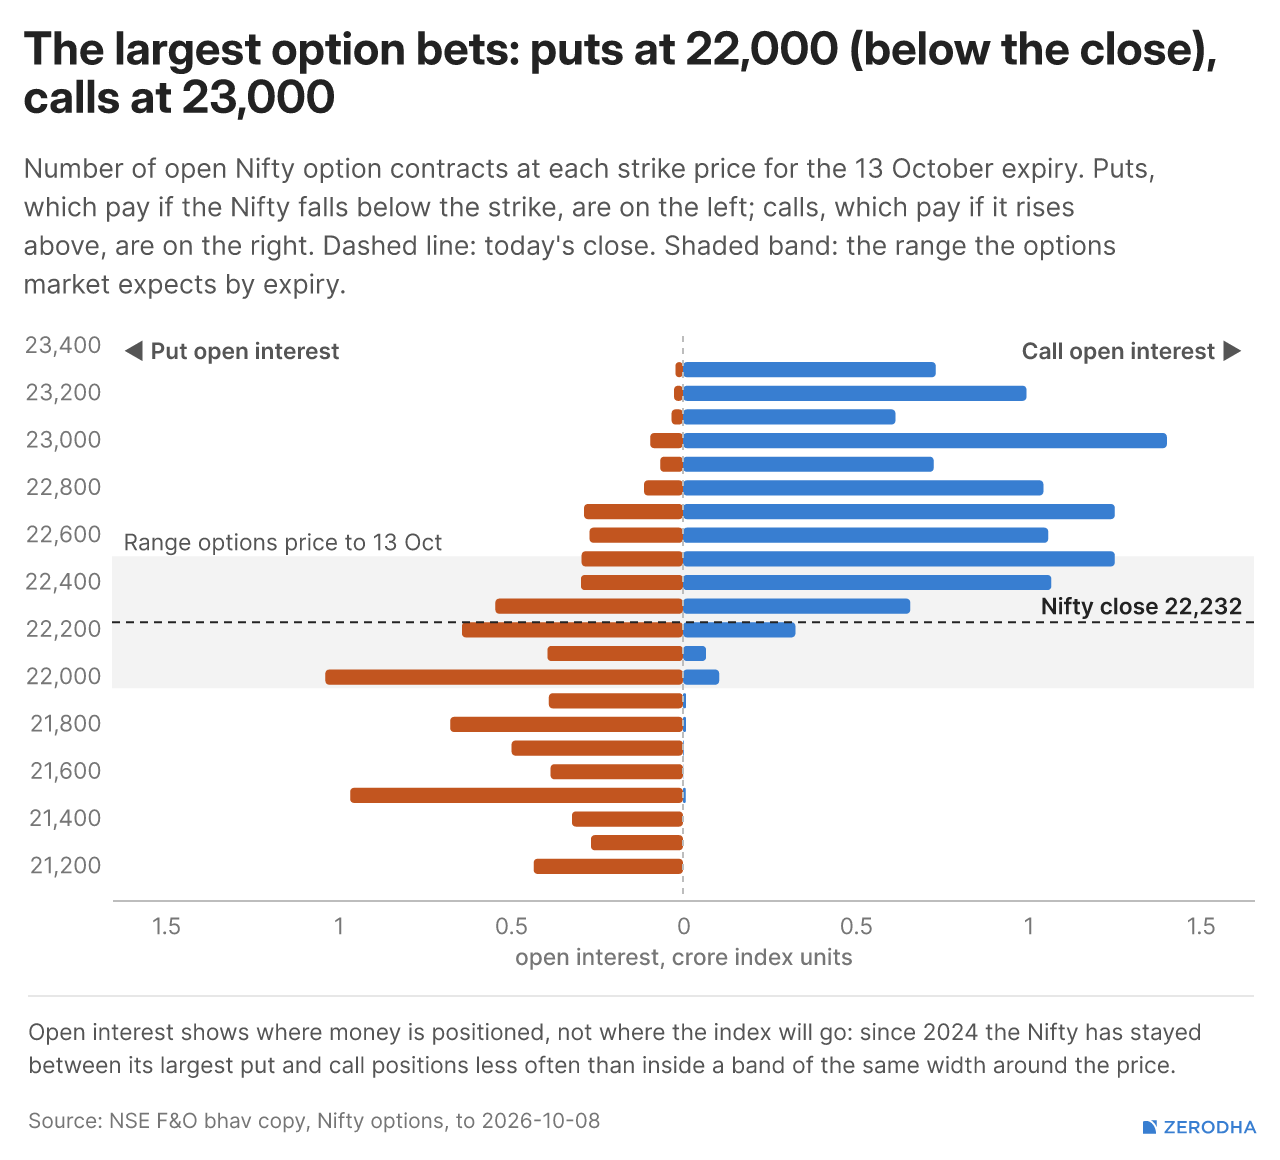
Options imply a 21,968-22,527 range into October 13 expiry, with the heaviest put OI at 21,000 and call OI at 23,000. The 20-day moving average at 23,019 remains the first major trend hurdle.

Top Stories in India
TCS reported a 14.9% YoY rise in Q2 FY27 net profit to ₹13,884 crore, while revenue grew 11.2% to ₹73,188 crore. Annualised AI revenue reached $3.1 billion, crossing 10% of total revenue, while deal wins stood at $9 billion, down from $9.5 billion in Q1. Dive deeper
The GST Council approved changes to expand input tax credit eligibility and allow refunds of accumulated credit on input services and capital goods. Businesses can now claim ITC on employee health and life insurance, telecom towers, pipelines and certain written-off inventory. Dive deeper
Shares of oil marketing companies, airlines and other crude-sensitive businesses fell up to 5% as rising oil prices raised concerns over higher operating costs and pressure on margins. Dive deeper
Tata Power shares hit a fresh 52-week low of ₹338.40 despite announcing a partnership with Norway’s Ocean Sun to pilot a 300 kWp floating solar project at its Mulshi reservoir in Maharashtra. Dive deeper
Tata Steel’s consolidated Q2 sales declined marginally YoY to 7.96 million tonnes, weighed down by weaker overseas operations. India sales rose 8% to 5.97 million tonnes, while domestic crude steel production increased 10% to 6.21 million tonnes. Dive deeper
Reliance shares fell around 2.6%, erasing nearly $5 billion in market value, after Elon Musk’s comments about alleged opposition to Starlink unsettled telecom investors. The stock’s decline contributed roughly 53 points to the Nifty’s fall. Dive deeper
Top Stories Globally
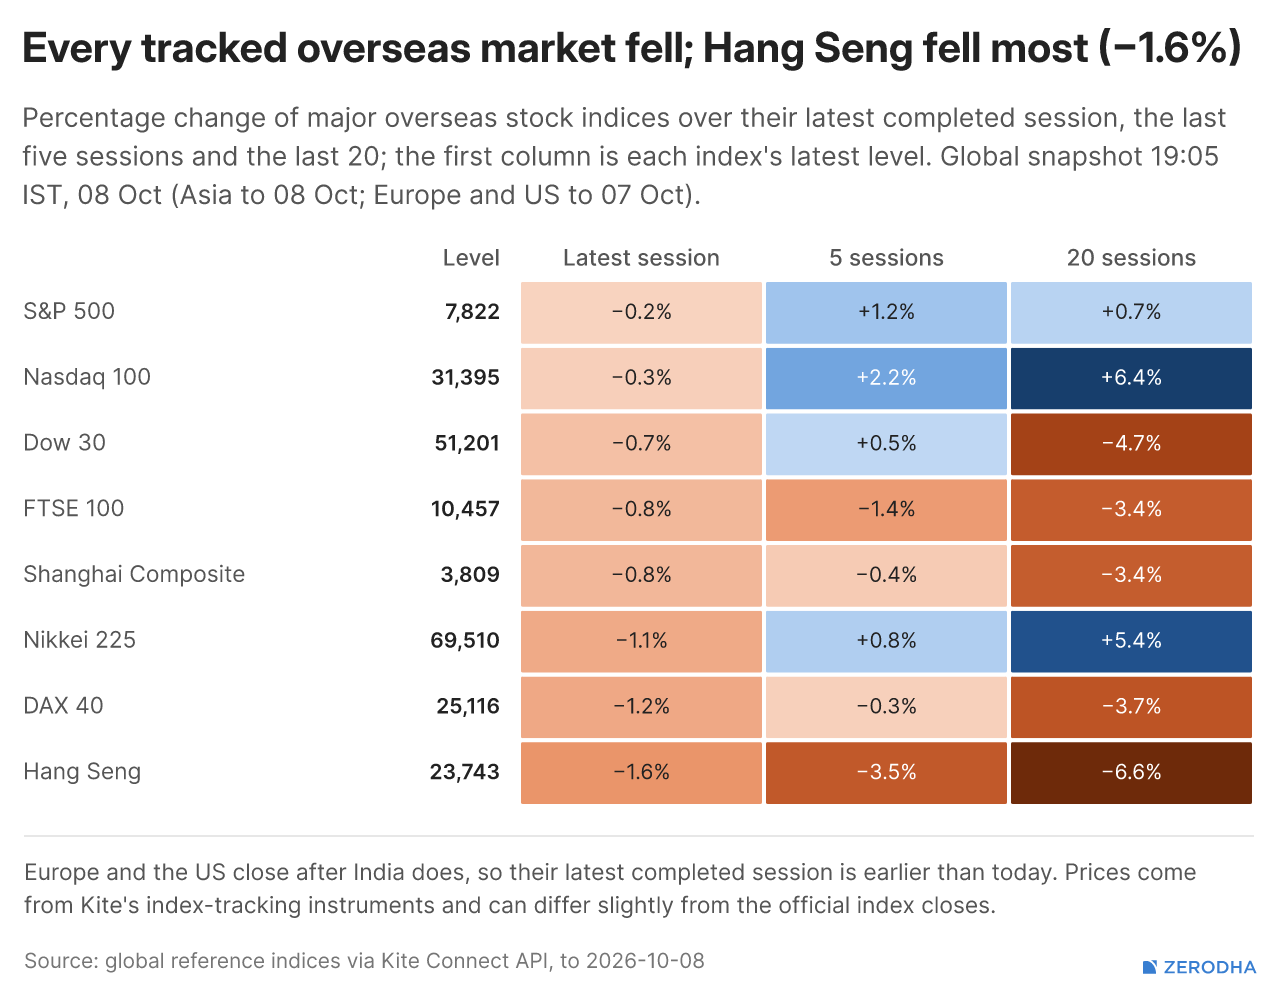
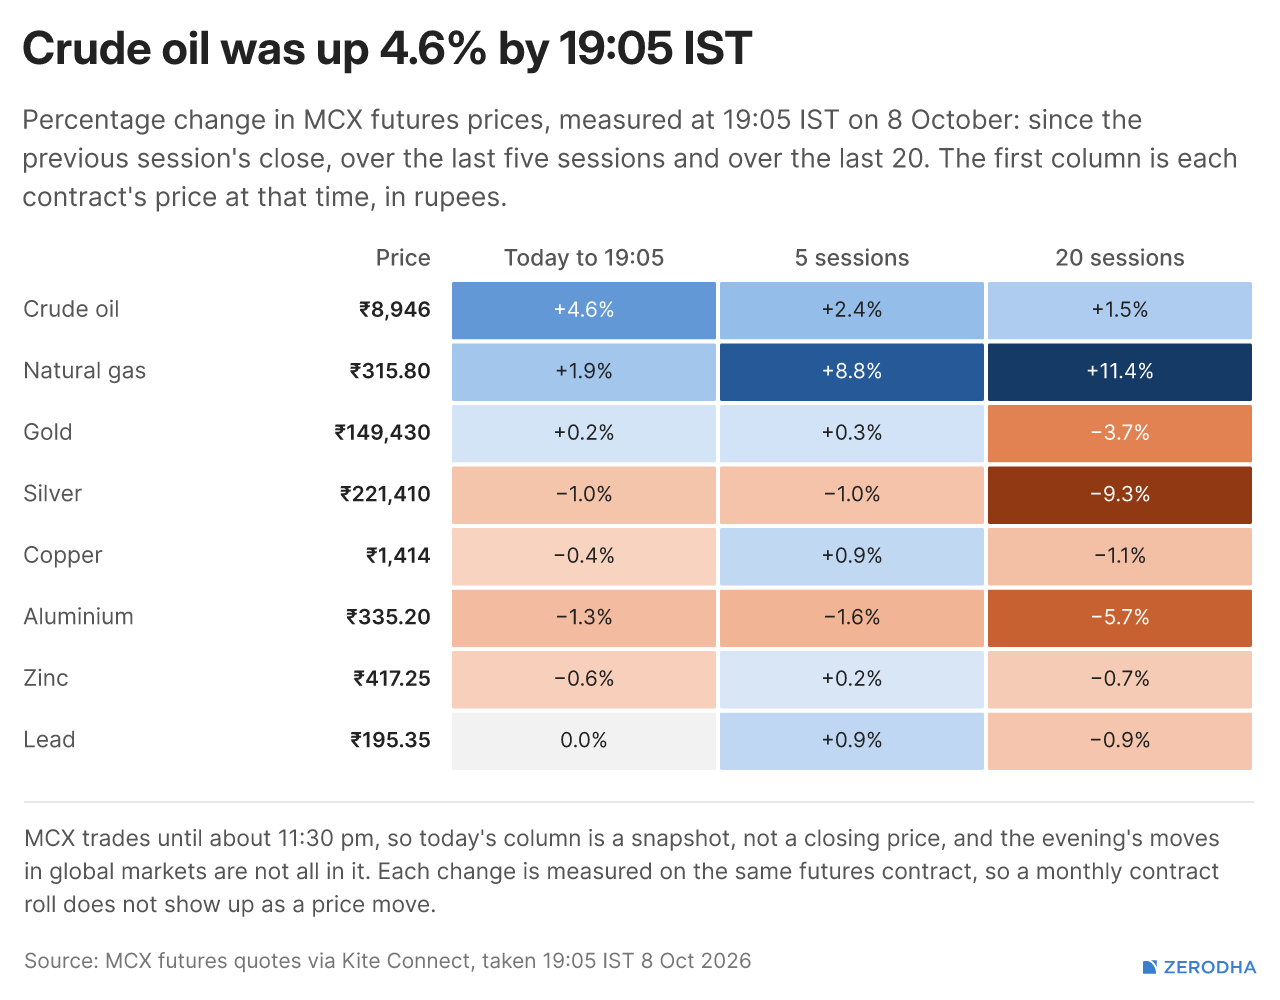
Crude oil climbed above $92.6 per barrel, its highest in nearly a month, amid renewed fears of Middle East supply disruptions following reports of potential US military action against Iran. Dive deeper
TSMC reported record Q3 revenue of T1.49trillion(46.7 billion), up 50% YoY, beating market expectations as strong demand for AI chips continued to drive growth. Dive deeper
Uniqlo owner Fast Retailing reported a 32% rise in annual operating profit to ¥743 billion, marking its fifth consecutive record year. Strong sales in North America and Europe drove growth, with the regions overtaking China as its largest market. Dive deeper
Samsung projected Q3 operating profit of 107.4 trillion won ($80.2 billion), up nearly ninefold YoY, driven by booming demand for AI memory chips. The estimate exceeded market expectations and would mark a record quarterly profit for a technology company. Dive deeper
Management Chatter
In this section, we highlight interesting comments from management at major companies and from policymakers in the Indian and Global Economies.
Union Minister Ashwini Vaishnaw on bringing out a consultation paper on AI regulations within a month, with AI safety, deepfakes and a human-first approach expected to be among its key focus areas:
“The time has come for AI regulations. I’ll request the department to come out with a regulation-focused consultation paper, which focuses on safety. That’s the most important point: safety related to AI use.” - Link
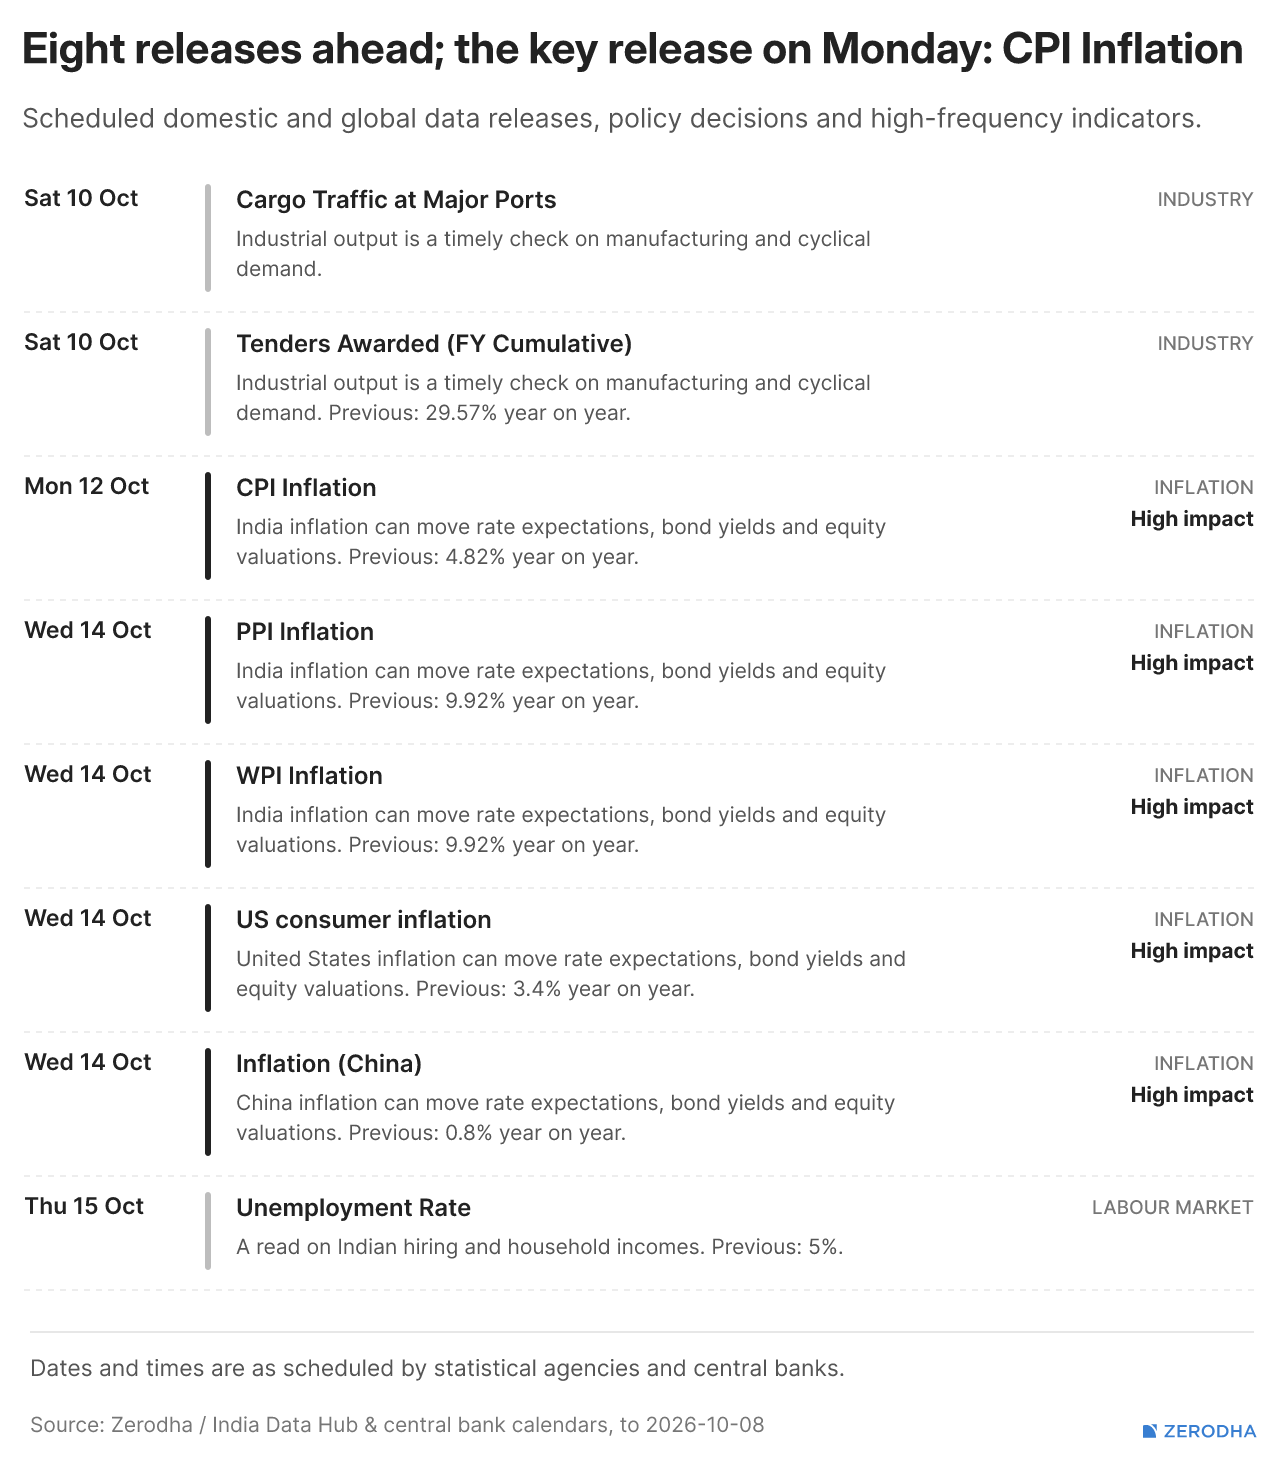
The week ahead & Corporate Actions
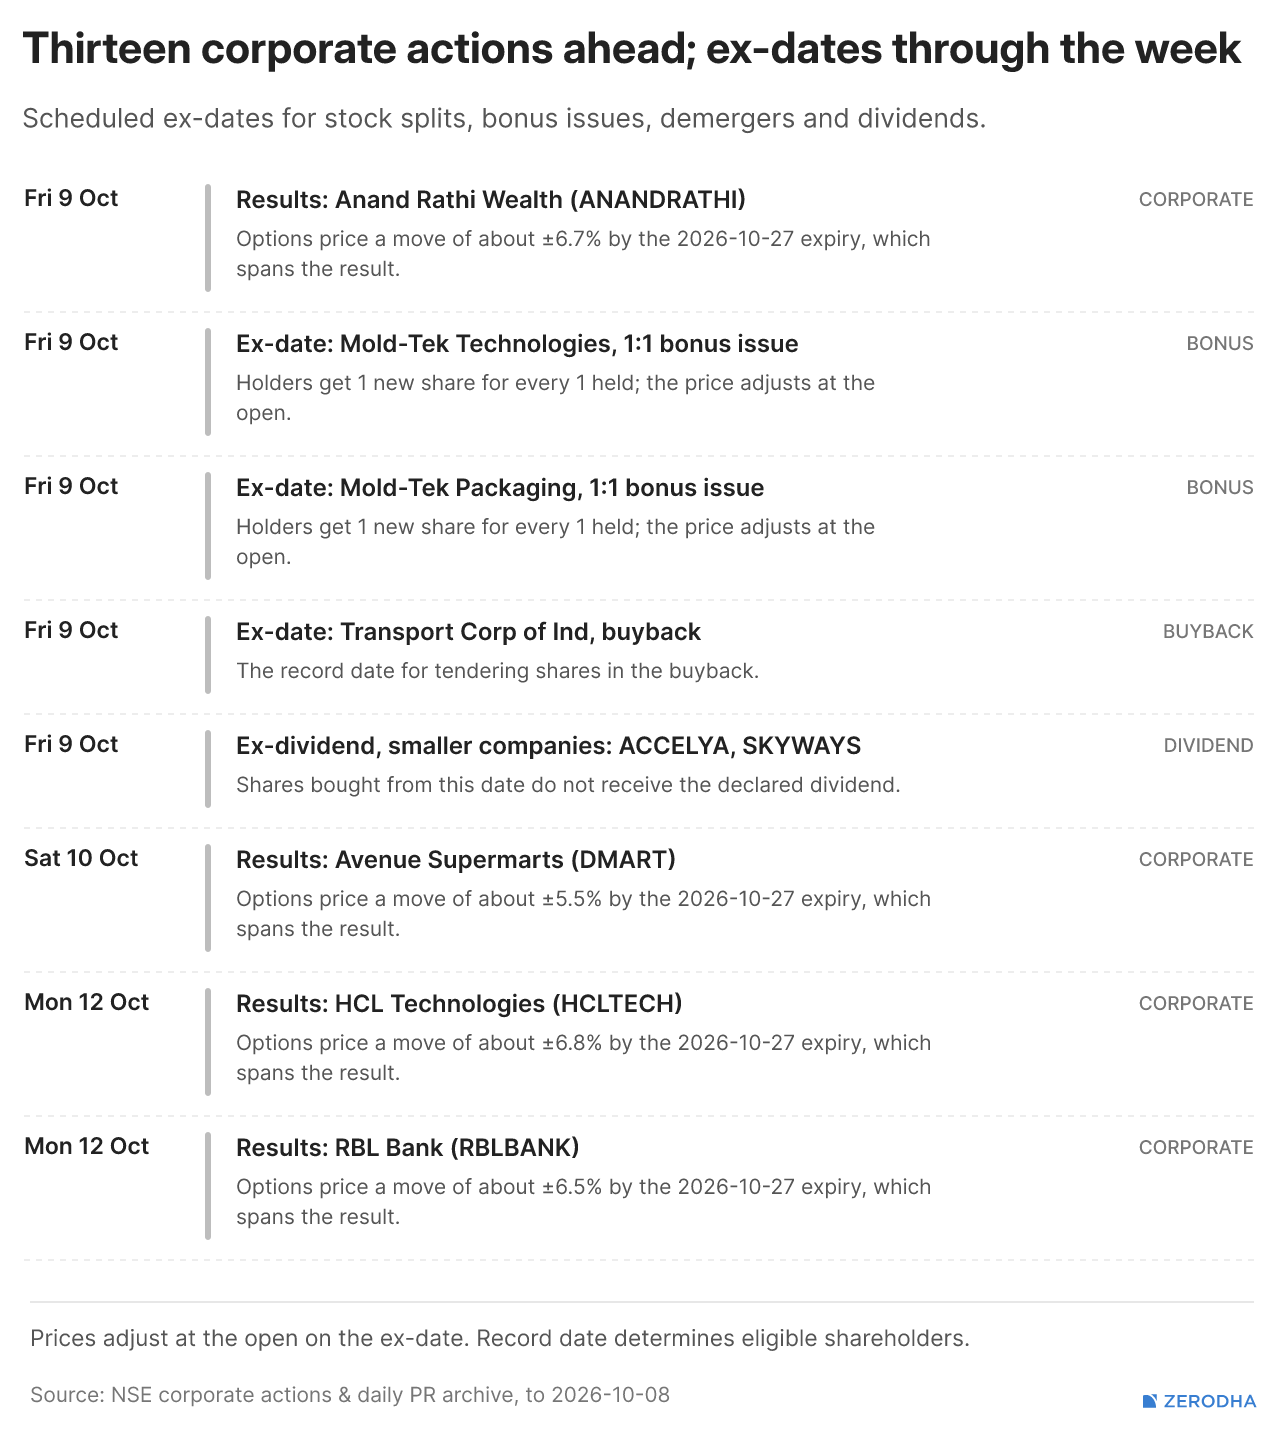
Corporate Actions
Published by Zerodha. Not investment advice. Data from NSE, BSE, and MCX.
In our latest episode of In The Money by Zerodha, we start with: What happens after a stock makes a new 52-week high? Is it a sign that the stock has already run too far, or could it actually tell us something about where the stock goes next?
We then look at the academic research behind the 52-week high effect, including the 2004 study by George and Hwang and more recent research on Indian stocks, before exploring the behavioural explanation for why the effect might exist.
Finally, we run our own backtest on the NIFTY 750, looking at stocks that make a new 52-week closing high, applying a 52-week cooldown between signals, and tracking what happens over different holding periods.
That’s it from us for today. We’d love to hear your feedback in the comments, and feel free to share this with your friends to spread the word!
You asked what's missing — mostly history on lines you already publish. The FII index-futures long share is the best number in today's edition, and it reads as a snapshot: 8.5%. Across your own recent editions it was 10.5%, 10.7% and 11.0% in late September, and 8% on 1 October. Three weeks into a falling market the foreign short has not been covered into the decline. That is a different statement from "FIIs are selling", and with retail and HNIs at 84% long on the other side, the series is the story rather than the level — even a rolling figure or a sparkline beside any positioning number would do it.
Whilst the report is looking good now - its a one report read for most of end of day information - would be great if you can add the PUT- CALL ratio to the index futures OI - its an important number for F&O traders.