Nifty lacks follow-through; Broader markets dull ahead of key results


Welcome to Aftermarket Report, a newsletter where we do a quick daily wrap-up of what happened in the markets, both in India and globally.
In our latest episode of In The Money by Zerodha video series, we explore the actual mechanics of building a mean reversion system—an approach that runs counter to trend following by betting that price has stretched too far and will snap back like a rubber band.
This episode breaks the concept into four distinct expressions: single-asset price reversion, volatility reversion through squeezes and narrow ranges, relative value trades across basis and spreads, and institutional-style pairs trading. We then put theory into practice by building and backtesting a long-only mean reversion strategy on Nifty and Gold using Bollinger Bands, to test whether “buying the fear” genuinely delivers alpha or simply feels intuitive.
Market Overview
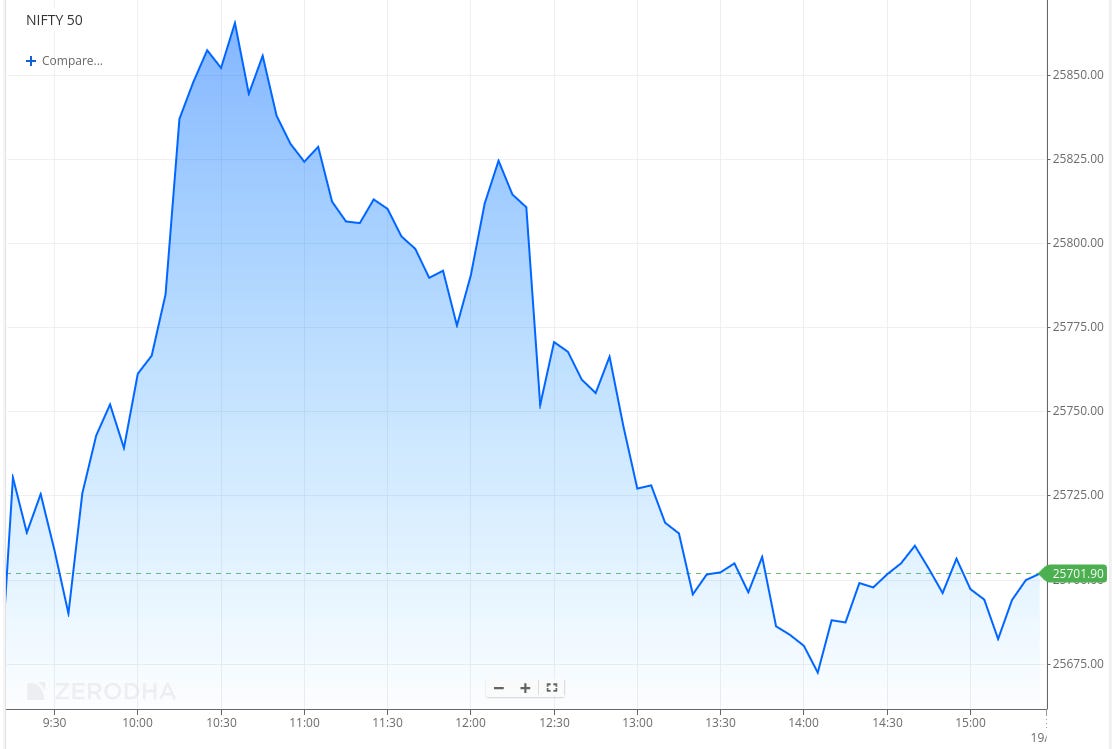
Nifty opened with a 31-point gap-down at 25,696 and witnessed early volatility, trading between 25,680 and 25,720 in the first 30 minutes. This was followed by a sharp rally, with the index climbing to the 25,850–25,870 zone by 10:30 AM as buying interest emerged at lower levels, led by the IT sector on the back of encouraging Infosys results. However, the early strength proved short-lived, as selling pressure resurfaced near higher levels and capped further upside.
Through the late morning and into the first half, Nifty gradually drifted lower, giving up most of its gains and slipping back toward the 25,780 zone. In the second half, weakness intensified as the index broke below 25,750 and slid steadily into the 25,680–25,700 range. The market remained largely range-bound within this 30–40 point band for the final two hours, before Nifty eventually closed near the day’s lower end at 25,694.35. Overall, it was a volatile session marked by early strength, followed by sustained selling pressure and a cautious undertone.
Looking ahead, markets are likely to remain sensitive to global risk appetite, the Q3 earnings season, the upcoming Union Budget, and further developments around India–U.S. trade negotiations.
Broader Market Performance:
The broader market had a mixed session tilted broadly towards bearish bias today. Out of 3,271 stocks that traded on the NSE, 1,339 advanced, while 1,830 declined, and 102 remained unchanged.
Sectoral Performance:
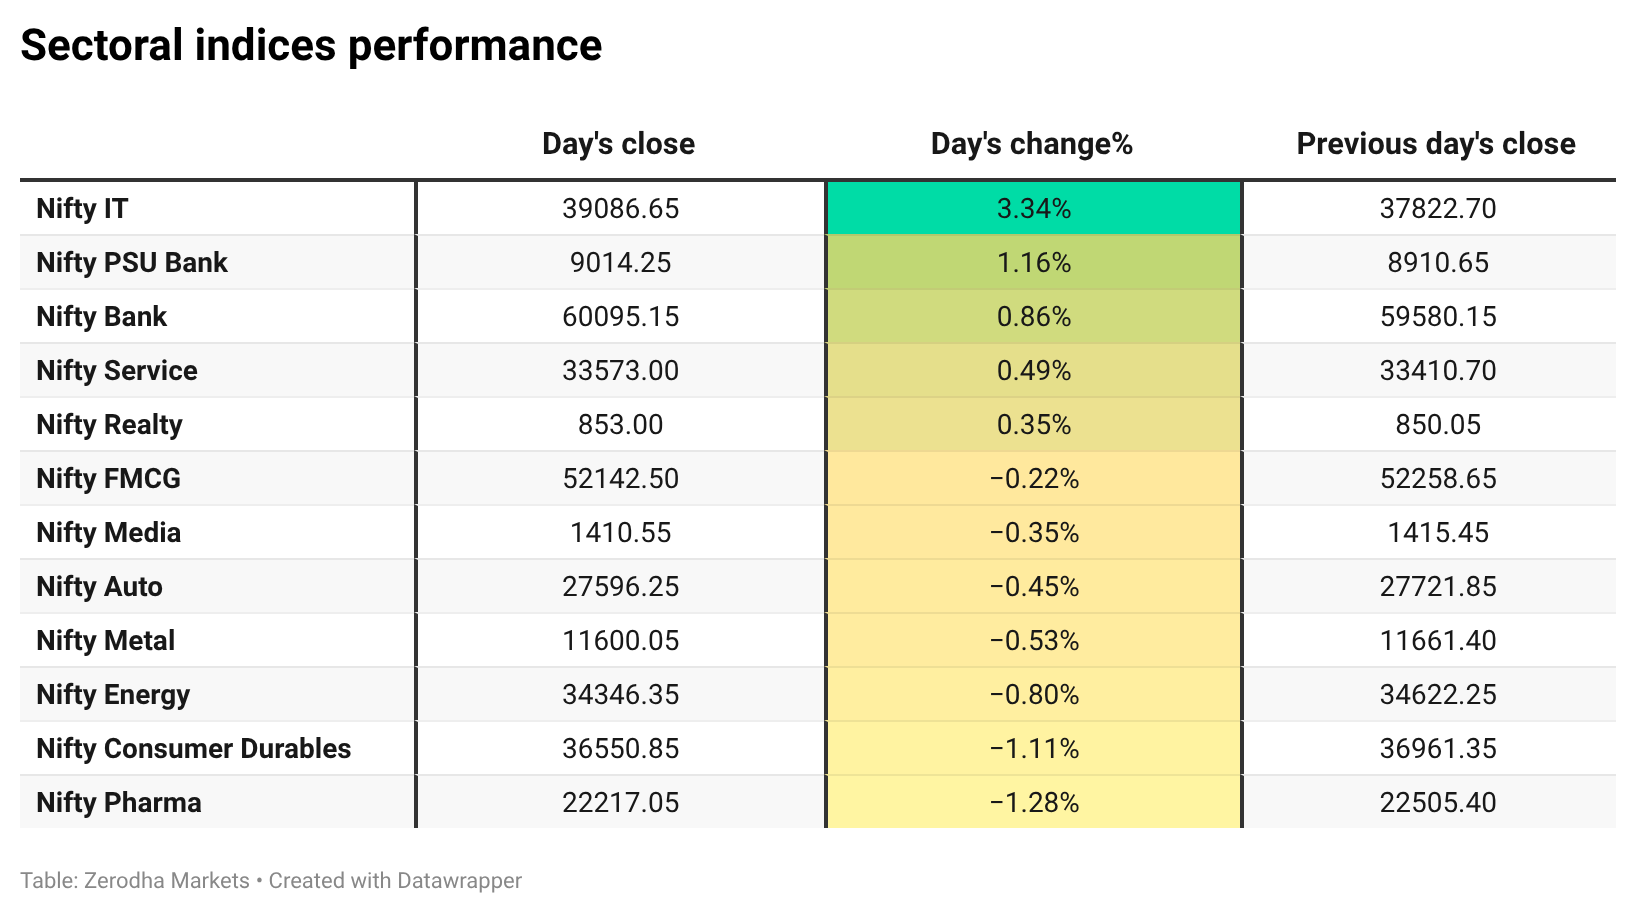
The top-gaining sector for the day was Nifty IT, which rose by 3.34%, while the worst performer was Nifty Pharma, slipping 1.28%. Out of 12 sectoral indices, 5 sectors closed in the green and 7 ended in the red, reflecting a mixed market tone with tech leading gains and healthcare under pressure.
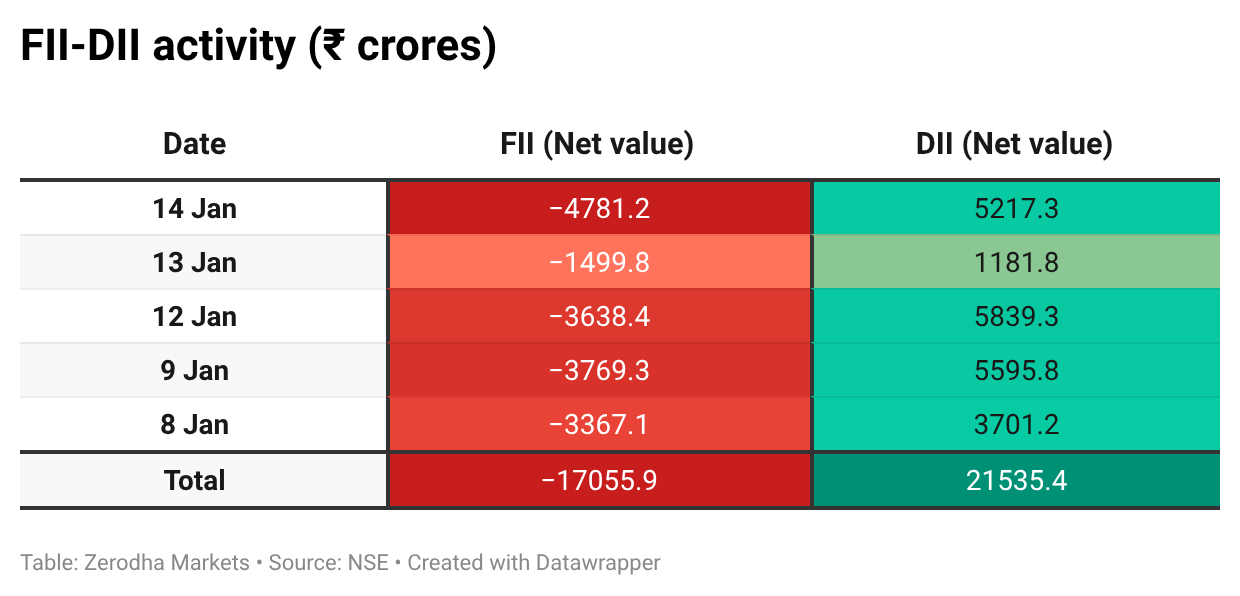
Here’s the trend of FII-DII activity from the last 5 days:
Change in OI for the day
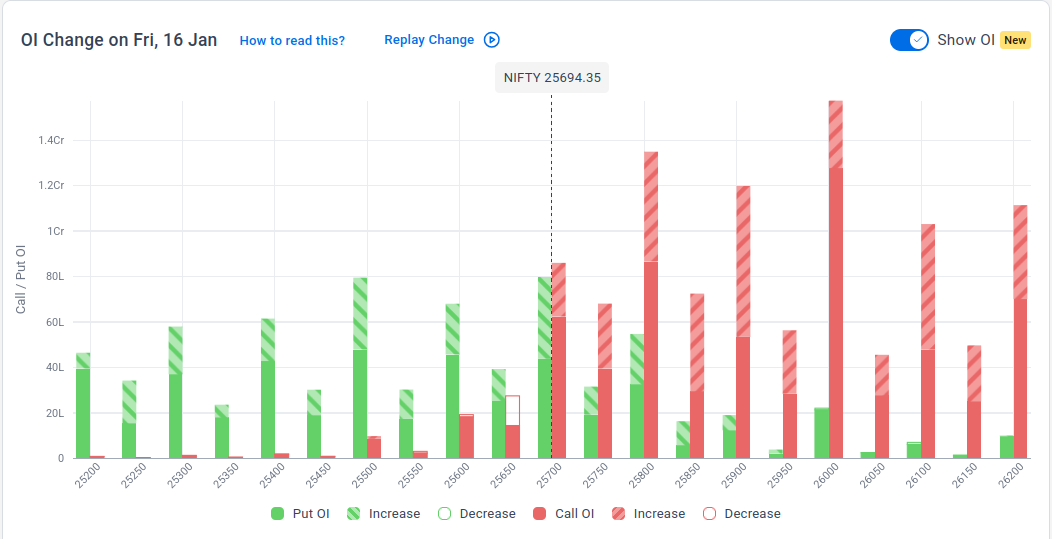
The following is the change in OI for Nifty contracts expiring on 20th January:
The maximum Call Open Interest (OI) is observed at 26,000, followed by 25,800, indicating potential resistance at the 25,900 -26,000 levels.
The maximum Put Open Interest (OI) is observed at 25,700, followed by 25,500, suggesting support at the 25,600 to 25,500 levels.
Note: OI is subject to multiple interpretations; however, generally, an increase in Call OI indicates resistance in a falling market, while an increase in Put OI indicates support in a rising market.
Source: Sensibull
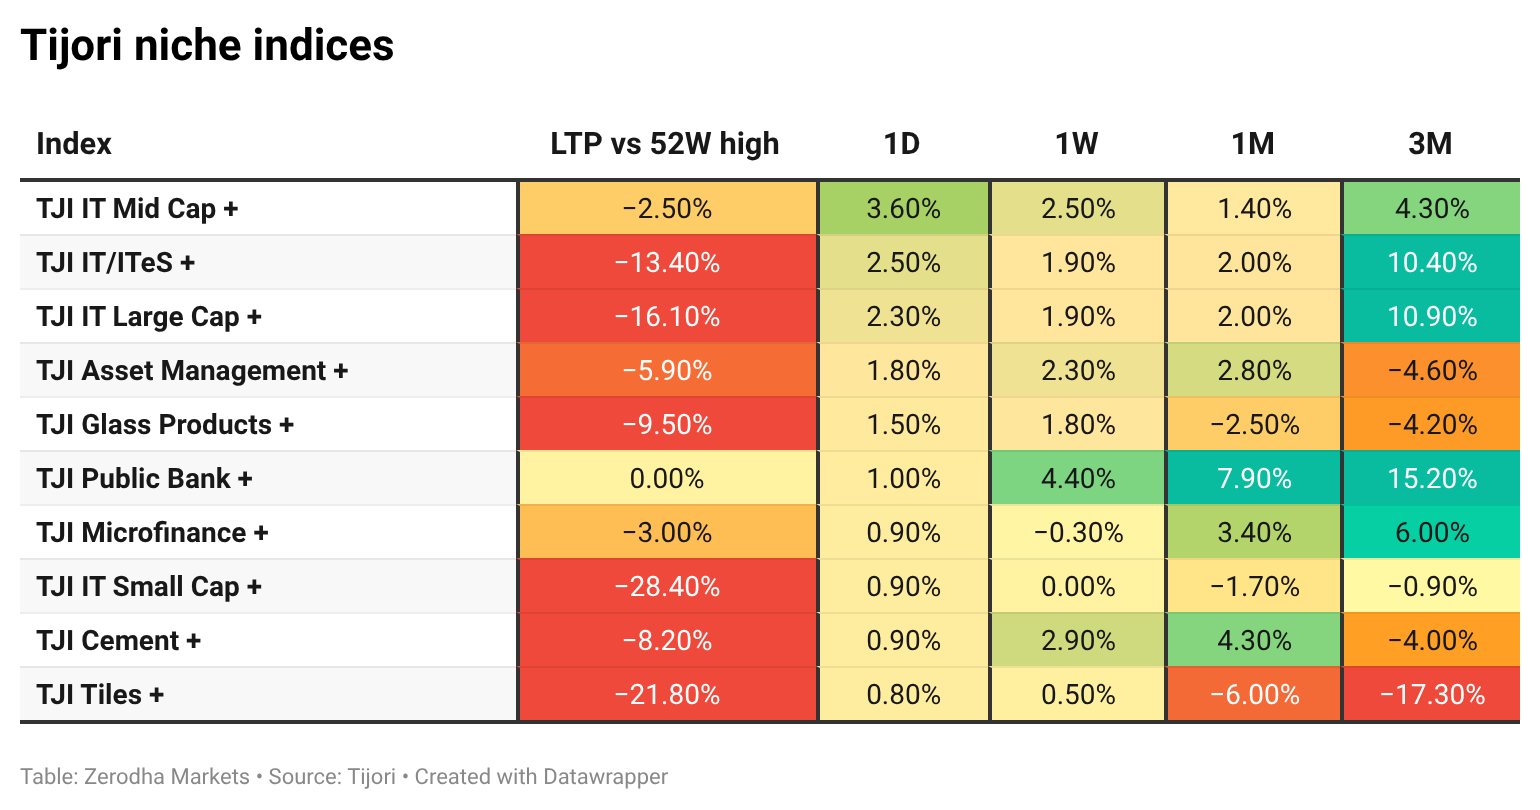
Tijori is an investment research platform that has constructed niche indices for various themes and sub-sectors. They help you understand the market performance of narrow slices of the market. You can also track the Promoter buying and other interesting stuff, like Capex activity by the companies in the Tijori App’s idea dashboard
What’s happening in India
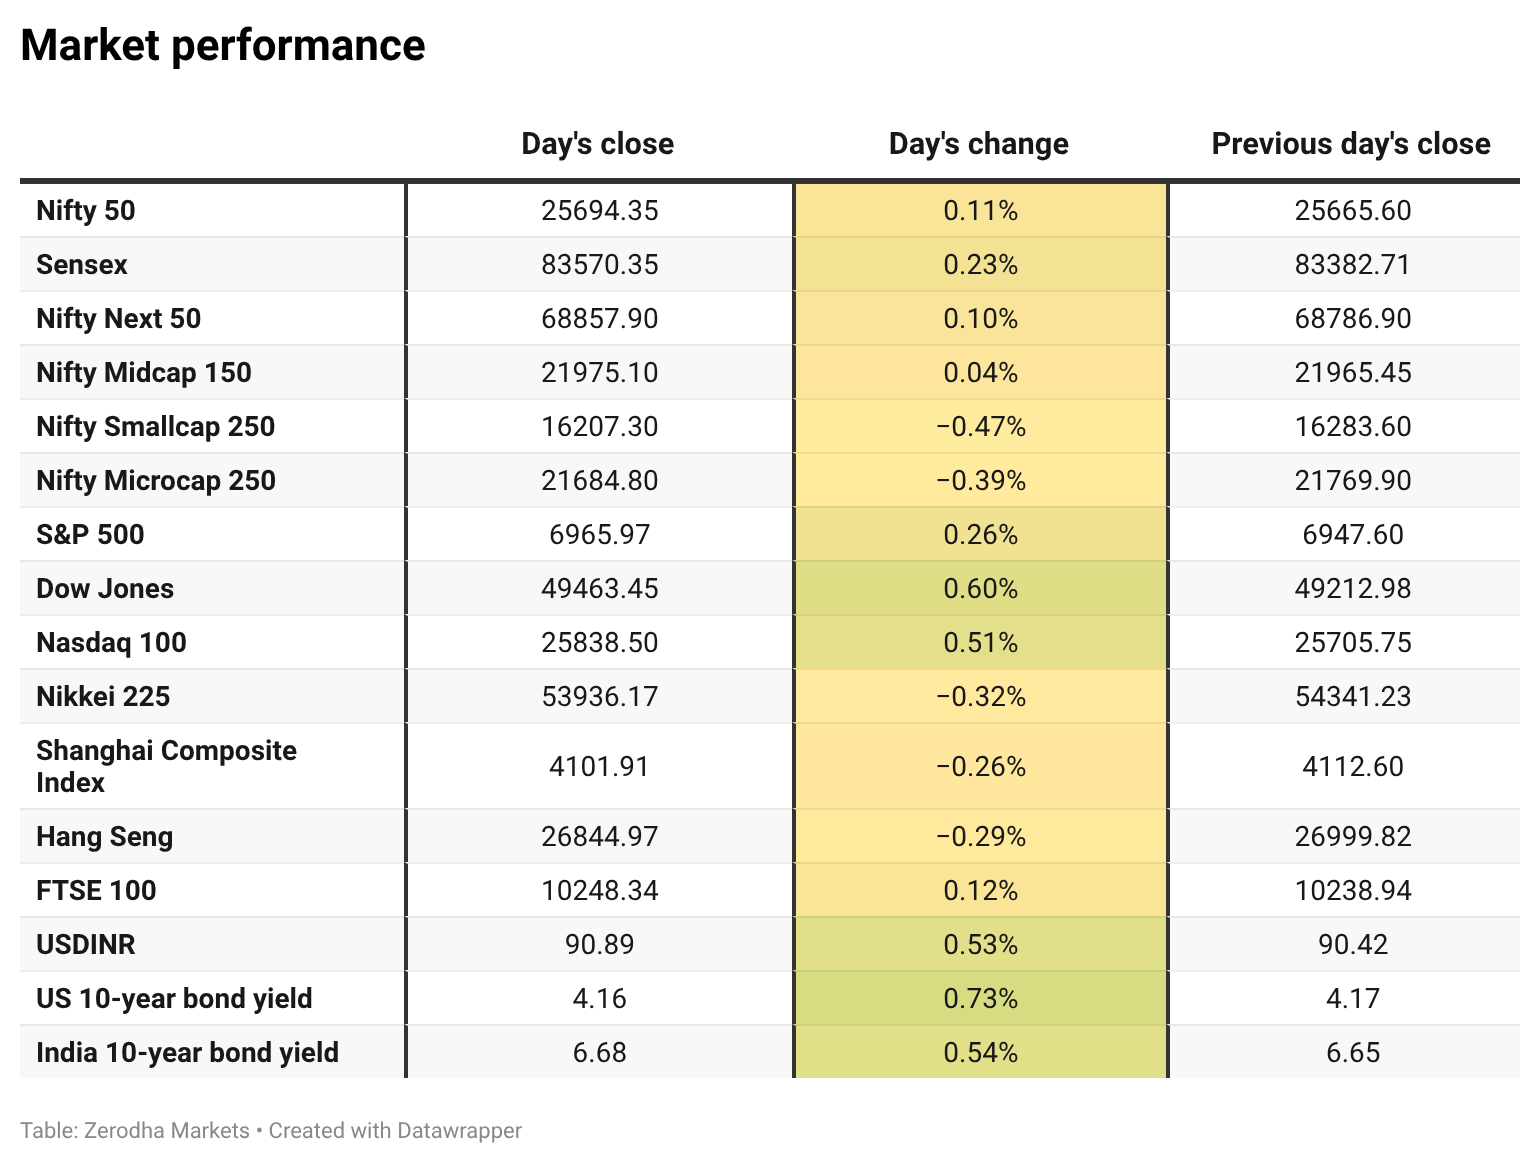
India’s 10-year government bond yield rose to around 6.67% as investors stayed cautious ahead of large bond auctions and weak demand dynamics. Sentiment was also pressured by the delay in global index inclusion, though softer inflation limited further upside in yields. Dive deeper
The rupee slipped to around 90.8 per dollar, its weakest in four weeks, weighed down by weak inflows, a firm dollar, and less dovish signals from the US Federal Reserve. Dive deeper
The Supreme Court ruled that Tiger Global is liable for capital gains tax on its 2018 sale of Flipkart, holding that the Mauritius structure used was an impermissible tax avoidance arrangement. The verdict could have wider implications as per tax experts, for over 500 foreign derivatives traders, with FPIs accounting for around 15% of India’s derivatives market volumes. Dive deeper
Tech Mahindra reported a 14.1% year-on-year rise in Q3 FY26 net profit to ₹1,122 crore, supported by strong margin expansion. Revenue grew 8.3% to ₹14,393 crore, while EBIT jumped 40.1% and margins expanded to 13.1%. The company also reported $1.1 billion in new deal wins, up 47% yoy, indicating improving demand momentum. Dive deeper
Wipro reported a decline in Q3 FY26 profitability, with net profit falling 4% sequentially and 7% year-on-year to ₹3,119 crore. The company said earnings were weighed down by cost pressures linked to labour code adjustments, adding that adjusted net income stood at ₹3,360 crore, up 3.6% QoQ and 0.3% YoY. Dive deeper
India’s power sector hit record milestones in 2025, successfully meeting a peak electricity demand of 242.49 GW in FY26, according to the Ministry of Power. National energy shortages were also reduced to just 0.03%. Dive deeper
Cipla reported a temporary halt in manufacturing of its key drug lanreotide injection due to a compliance-related issue at a facility. The company said it is working to address the matter and resume production. Dive deeper
India and the European Union are close to finalising a long-pending trade agreement this month, which would become India’s largest such pact. The move comes as talks with the US continue to face delays amid tariff-related challenges. Dive deeper
India’s merchandise trade deficit widened slightly in December as imports rose, while exports to the US remained resilient despite higher tariffs. Officials said outbound shipments have stabilised, supporting the broader export outlook. Dive deeper
What’s happening globally
WTI crude hovered around $59 a barrel as easing tensions around Iran reduced immediate supply disruption risks, though uncertainty remained. Oil prices were on track to end the week largely flat after recent gains. Dive deeper
Gold eased to around $4,600 an ounce as reduced geopolitical tensions and strong US data tempered expectations of near-term Fed rate cuts. Prices, however, remained near record levels and were set for a second straight weekly gain. Dive deeper
The dollar index hovered near 99.3, on track for a third straight weekly gain as strong US data reduced expectations of near-term Fed rate cuts. Markets now expect policy to remain unchanged this month, with any easing likely later in the year. Dive deeper
US stock futures inched higher after Wall Street posted broad gains, led by banks and technology stocks. Semiconductor strength on upbeat earnings and AI optimism supported sentiment, though geopolitical risks kept investors cautious. Dive deeper
European gas prices rose to around €35/MWh, the highest since late July, as colder weather forecasts heightened concerns over supply and storage levels. Lower LNG exports from the US and rising competition from Asia further tightened the market. Dive deeper
Germany’s inflation eased to 1.8% in December, falling below the ECB’s target for the first time in over a year, led by softer goods and energy prices. Core inflation also declined to its lowest level since 2021, while services inflation remained elevated. Dive deeper
Singapore’s non-oil domestic exports rose 6.1% year-on-year in December, slowing from November and missing expectations as non-electronic shipments weakened. Strong growth in electronics exports was partly offset by a sharp month-on-month decline in overall exports. Dive deeper
Management chatter
In this section, we highlight interesting comments made by the management of major companies and policymakers from the Indian and Global Economies.
Peter McGuire, CEO of Australia-Trading.com, on the outlook for global oil prices:
“Crude could trade in the low-to-mid $50 range if Middle East tensions remain contained.”
He warns that “markets are still vulnerable to geopolitical developments,” meaning prices could spike again depending on events in Iran, OPEC+ and Venezuela.
The future trajectory of oil prices “will heavily depend on factors involving Iran, the OPEC+ alliance, and Venezuela,” given their influence on global supply. - Link
Vibha Padalkar, MD & CEO, HDFC Life, on GST impact and profit outlook:
“Over the next two quarters, we will reduce [the GST impact] further and neutralise it. We are slightly ahead of plan.”
“The PAT on the face of it looked muted at 1% growth, but as you know, we have had a GST impact and impact of the wage code. Backing that out, it would be 15% growth.”
“Our margins expanded if you take out the impact of GST… the fourth quarter should be better than the third quarter.” - Link
🧑🏻💻Have you checked out The Chatter?
Every week, we listen to the big Indian earnings calls—Reliance, HDFC Bank, and even smaller logistics firms—and copy the full transcripts. We then remove the fluff and keep only the sentences that could move a share price: a surprise price hike, a cut-back on factory spending, a warning about weak monsoon sales, or a hint from management on RBI liquidity. We add a quick, one-line explainer and a timestamp so you can trace the quote back to the call. The whole thing lands in your inbox as one sharp page of facts you can read in three minutes—no 40-page decks, no jargon, just the hard stuff that matters for your trades and your macro view.
Go check out The Chatter here.
So, we’re now on Reddit!
We love engaging with the perspectives of readers like you. So we asked ourselves - why not make a proper free-for-all forum where people can engage with us and each other? And what’s a better, nerdier place to do that than Reddit?
So, do join us on the subreddit, chat all things markets and finance, tell us what you like about our content, and where we can improve! Here’s the link — alternatively, you can search r/marketsbyzerodha on Reddit.
See you there!
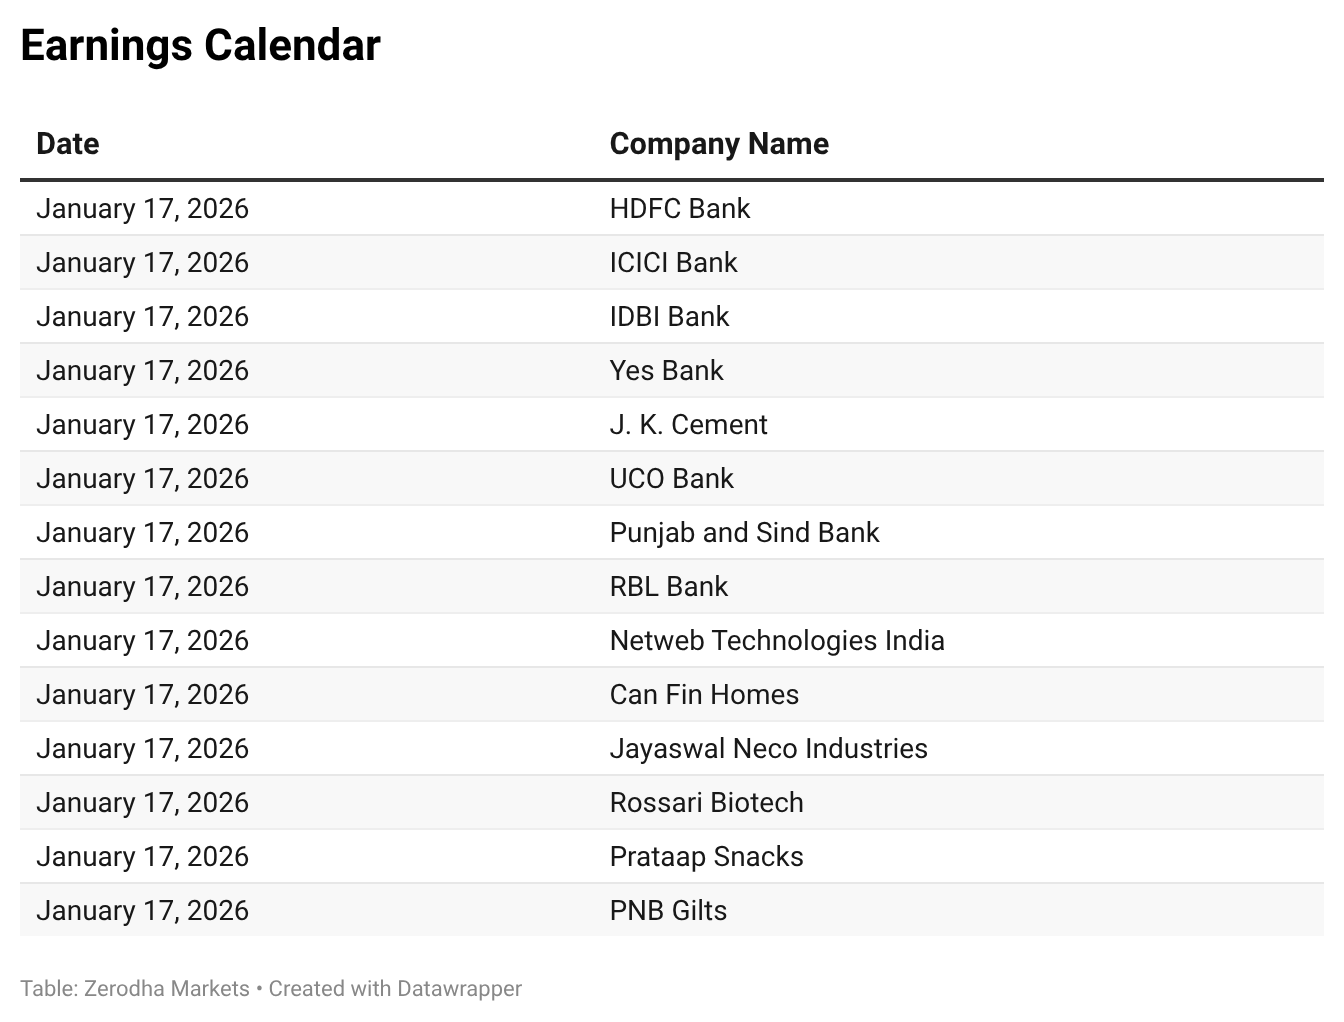
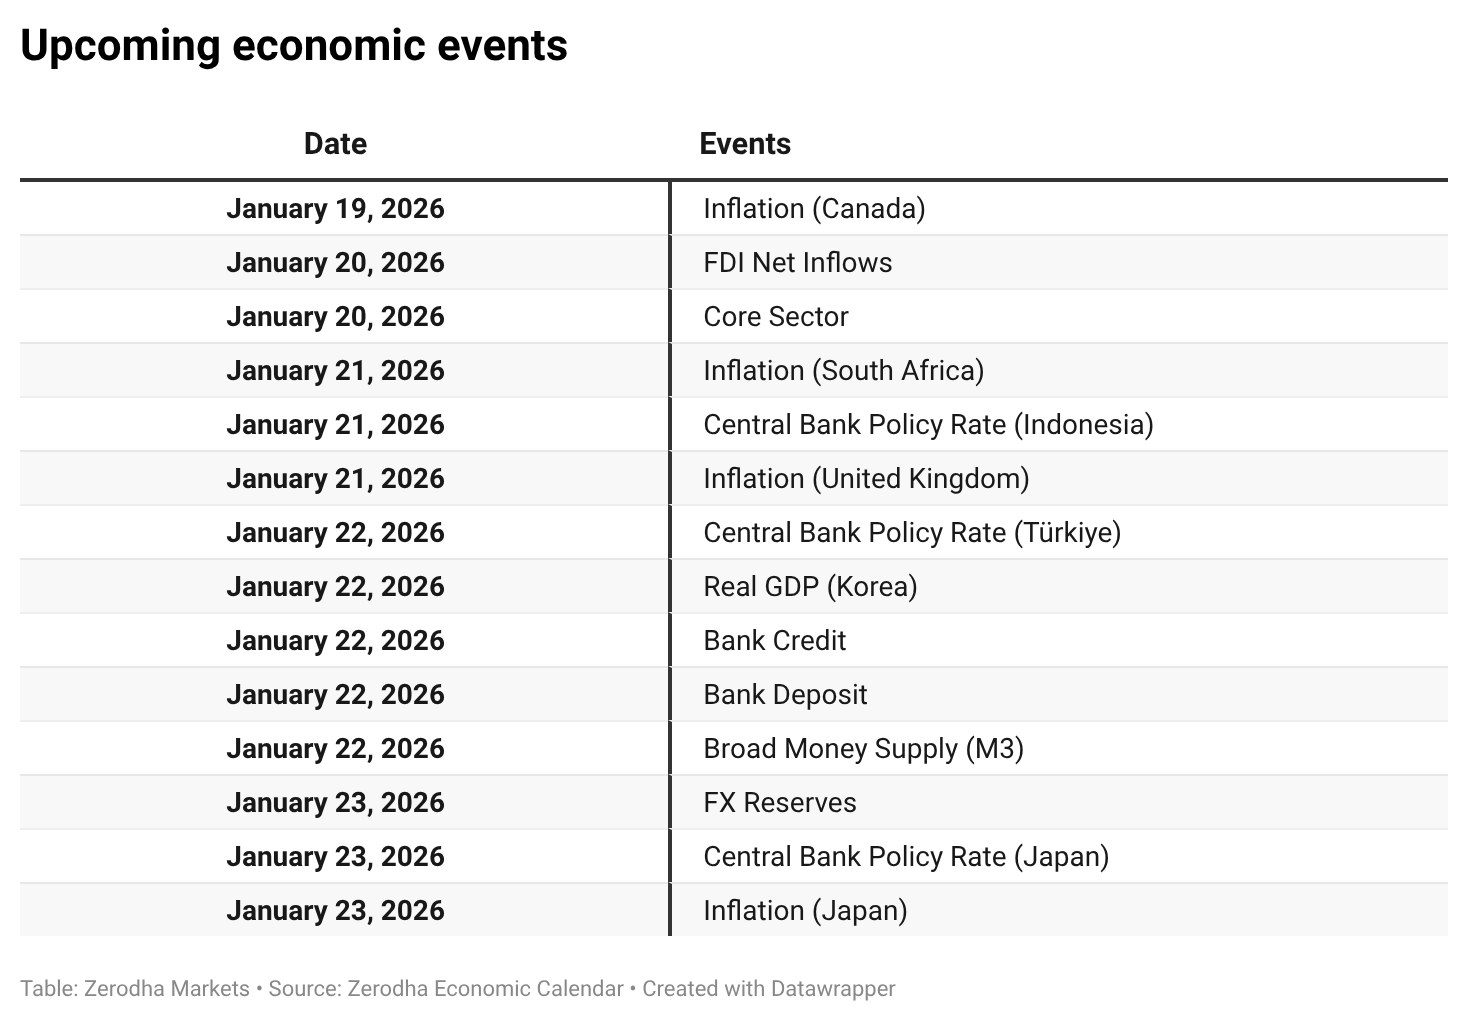
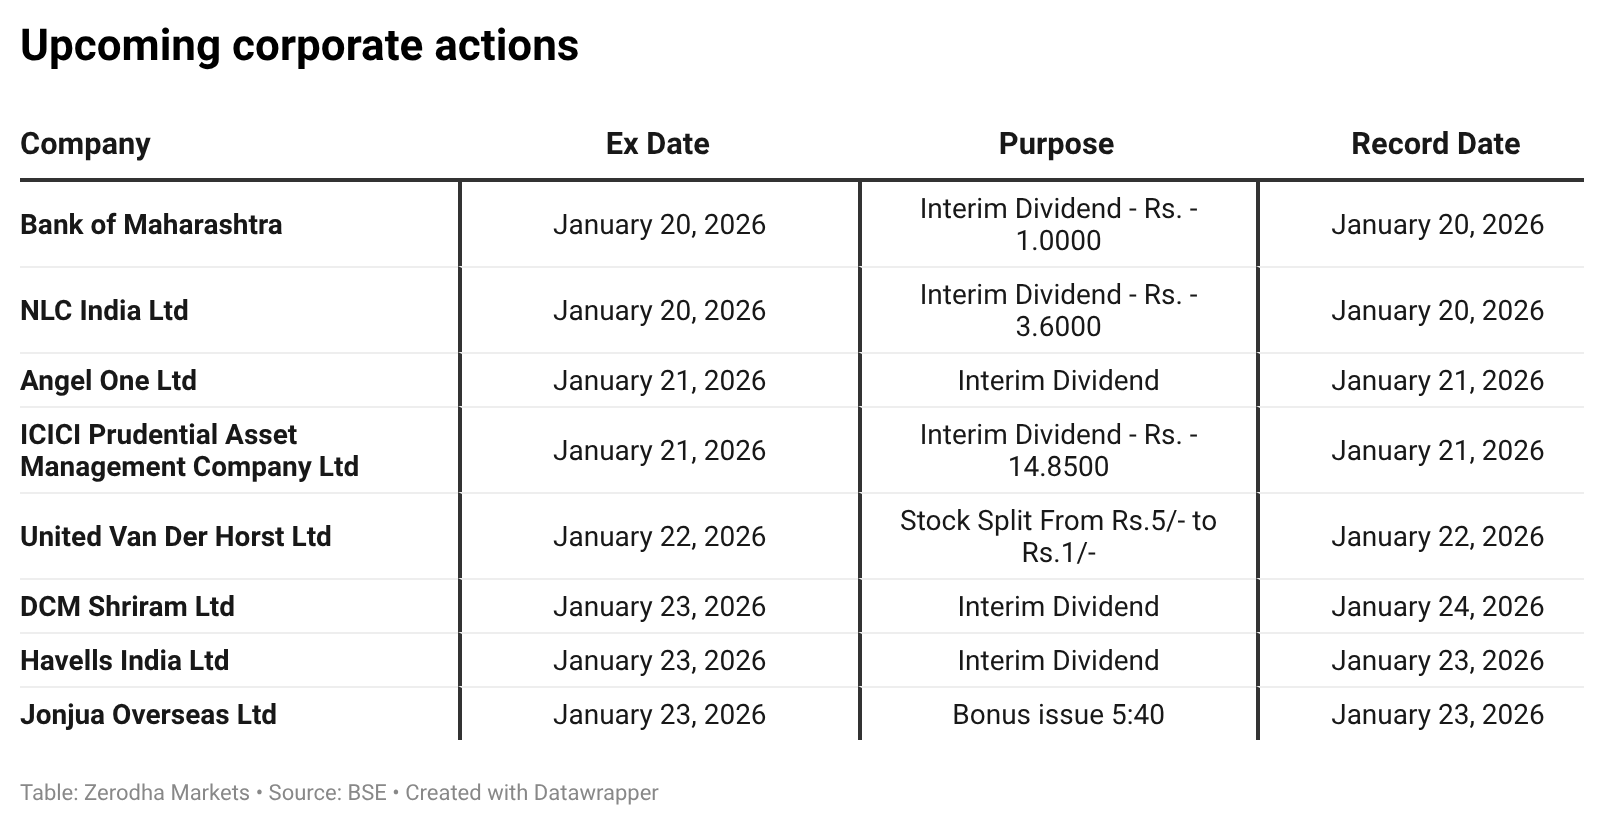
Calendars
In the coming days, we have the following significant events, quarterly results, and corporate actions:
That’s it from us for today. We’d love to hear your feedback in the comments, and feel free to share this with your friends to spread the word!
Can you provide volume details also