
Welcome to the first weekly edition of Aftermarket Report, where we wrap up the week in the markets and take you through everything that mattered, both in India and globally.
What data points and transformations do you want to see?
We’re also experimenting with a weekly edition of the Aftermarket Report, and we’d love to know what you’d find useful in it.
Unlike the daily report, the idea here is to step back from individual trading sessions and look at the bigger picture — what changed over the week, where trends are building, how sectors and themes are moving, how positioning has shifted, and what the data tells us when viewed over a longer timeframe.
We’re exploring everything from weekly market breadth, sector and thematic trends, F&O positioning and flows to volatility, commodities, global markets, and more. But we want to know what you would like to track.
What data points, transformations, ratios, comparisons, charts, or indicators would make a weekly market wrap genuinely useful for you?
Tell us what you’d like to see. Your feedback will help us shape the weekly edition of the Aftermarket Report.
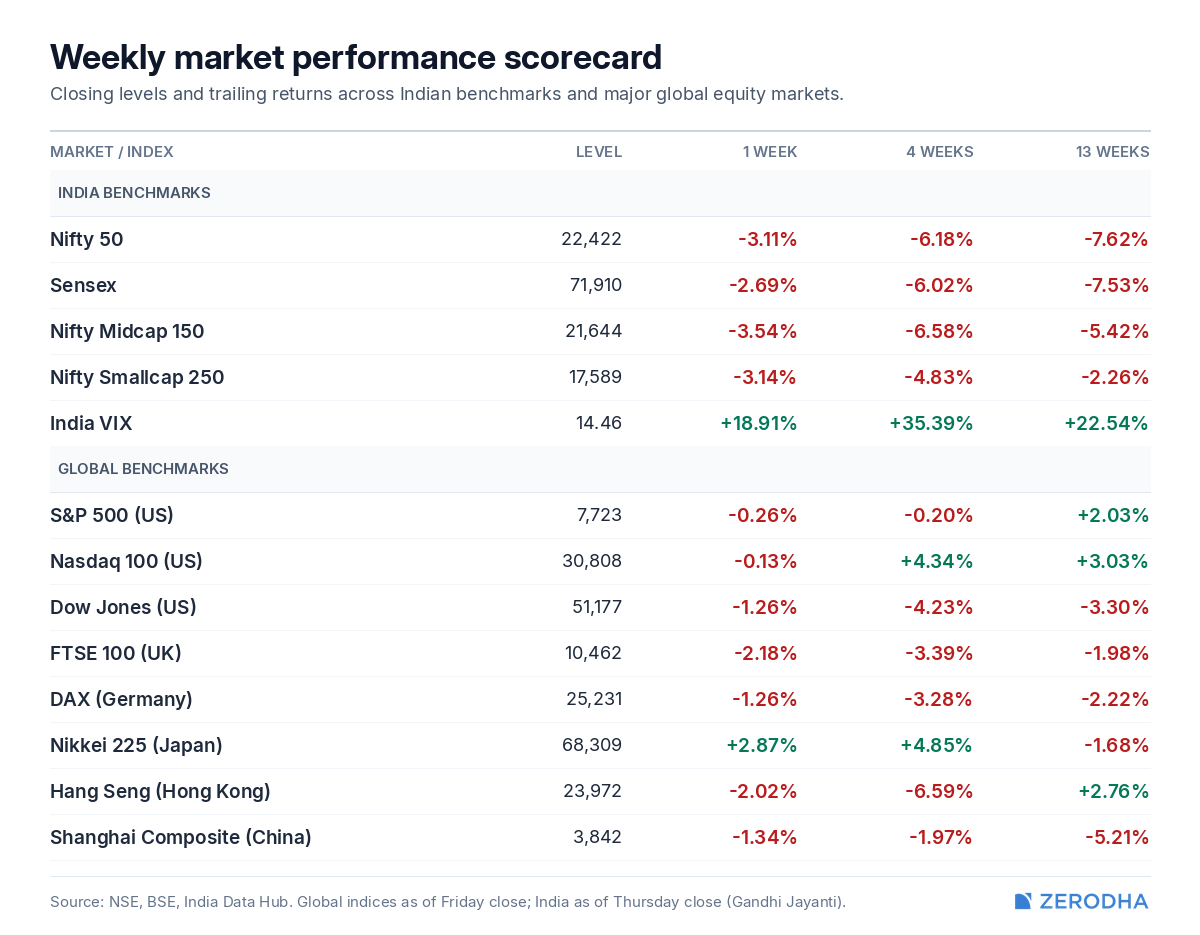
Weekly market performance
It was a difficult week for Indian equities, with the Nifty falling 3.11% and broader markets also ending sharply lower. Volatility jumped nearly 19%, while global markets were largely weak, barring Japan.
What is the macro backdrop doing?
The rupee weakened further, while India’s 10-year yield climbed to its highest level in the past year. Crude and gold, meanwhile, both declined during the week.
What followed weeks like this one?
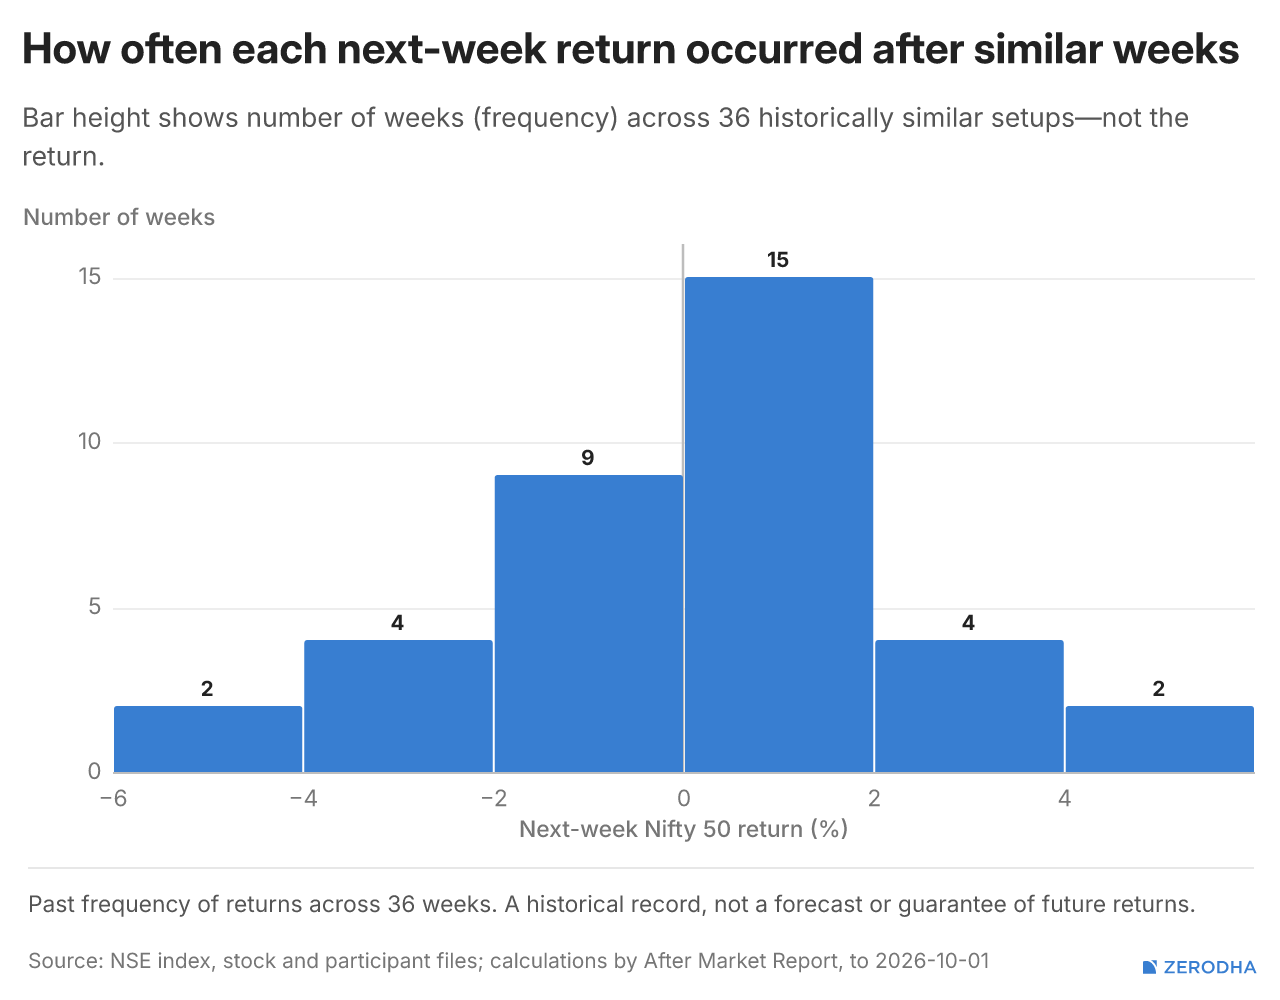
This week’s market condition: the Nifty sits 7.3% below its 40-week average, while India VIX is higher than 70% of days over the past year. In historical records back to 1 April 2022, 36 weeks had a comparable combination of trend distance and volatility rank (within 5 percentage points on trend and 25 points on VIX).
The chart below shows how often each return range occurred: the bar height represents the number of historical weeks (observations), not the return percentage. For example, after a negative week with elevated volatility, on 15 occasions the Nifty went on to gain between 0% and 2% the following week (the tallest bar in the chart), while on 9 occasions it fell between -2% and 0%.
Across all 36 comparable weeks, the Nifty’s median return was +0.33%, and it gained in 58% of those weeks. For comparison, across all weeks in our database, the median one-week return was +0.32% with 56% positive weeks. The middle 80% of historical outcomes ranged between -2.63% and +2.81%.
Over four weeks, the median return was +1.05%, positive in 60% of instances.
Historical base rates describe how markets behaved after similar technical setups in the past; they do not forecast or guarantee future returns.
How often each next-week return occurred across 36 historically similar weeks. Bar height shows the number of weeks (occasions), not the return percentage.
Sectoral summary
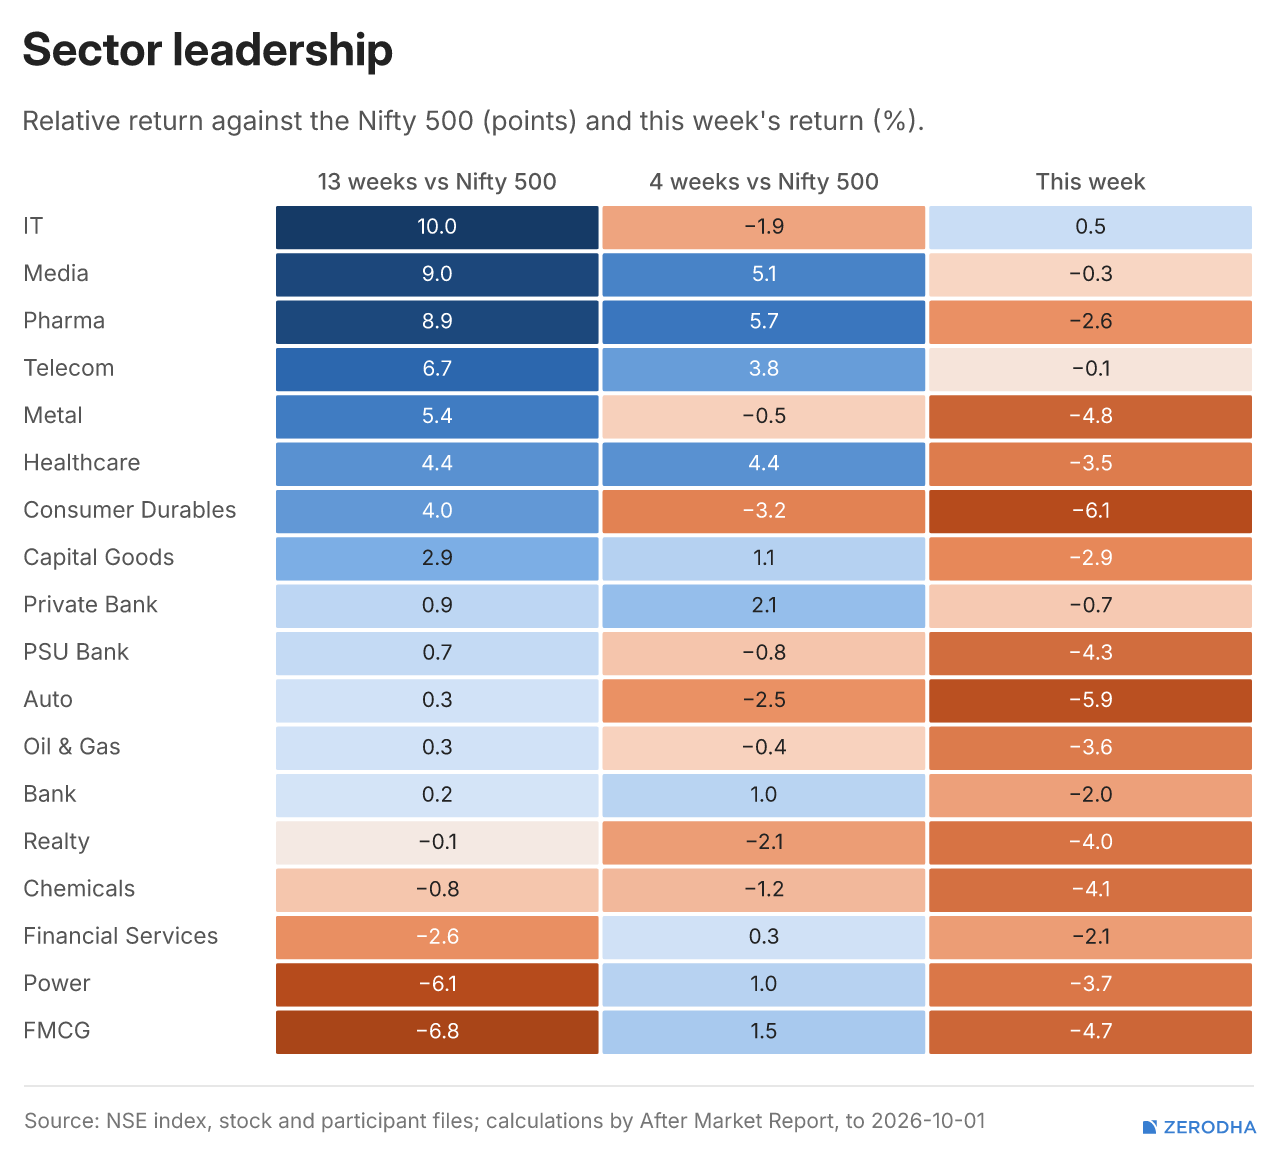
Media, Pharma, Telecom and Healthcare continue to show relative strength, while Financial Services, Power and FMCG are improving. Sector leadership remains fluid, with none of the top three sectors from four weeks ago retaining their position. IT was the standout performer last week.
Selective stock screeners
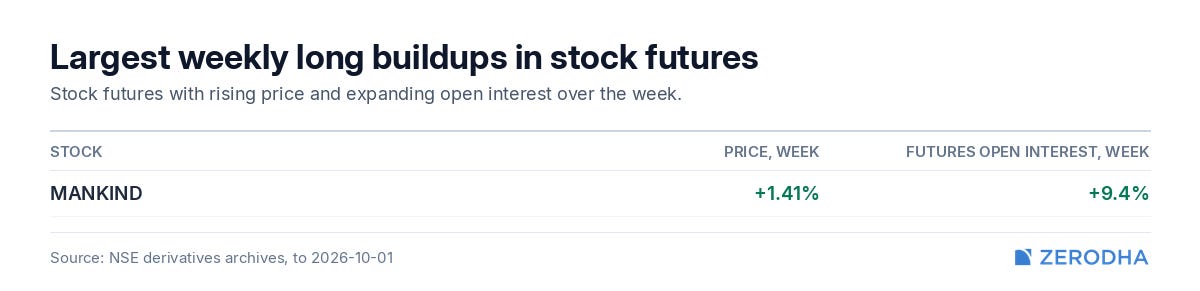
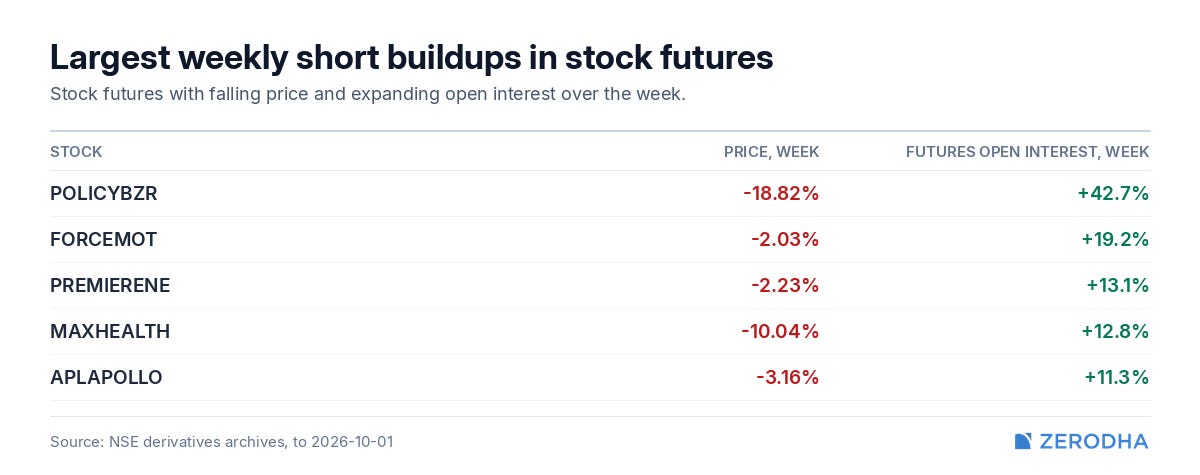
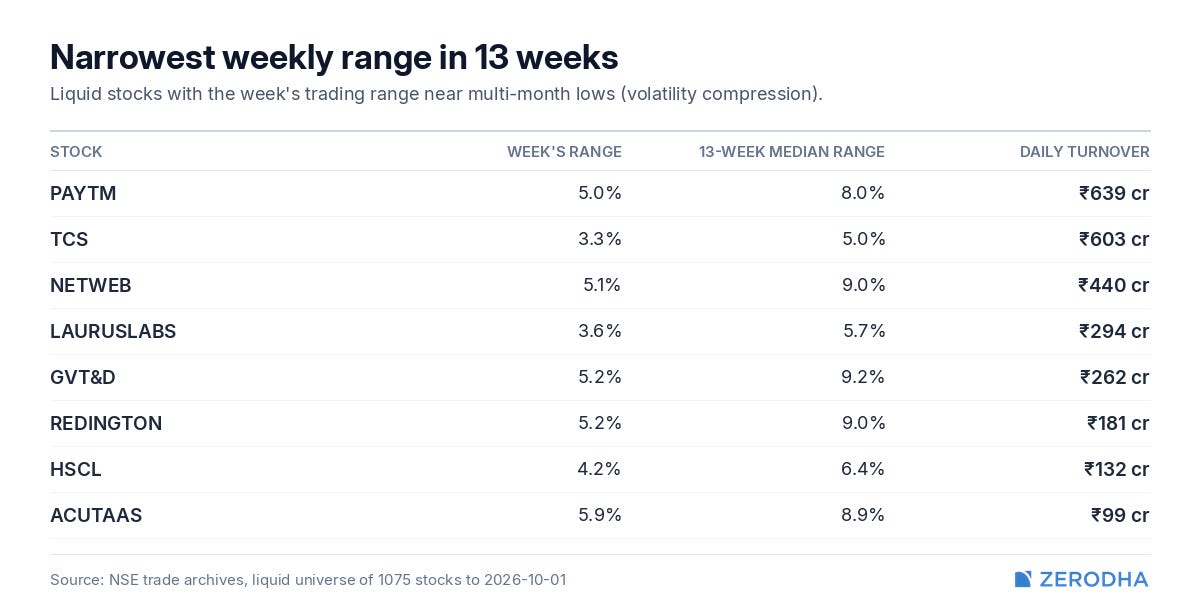
None of the 1,075 tracked liquid stocks closed at a 52-week high, while eight stocks recorded their narrowest weekly range in 13 weeks. POLICYBZR saw the largest short buildup among the highlighted F&O stocks, while MANKIND saw a long buildup.
Deals of the week
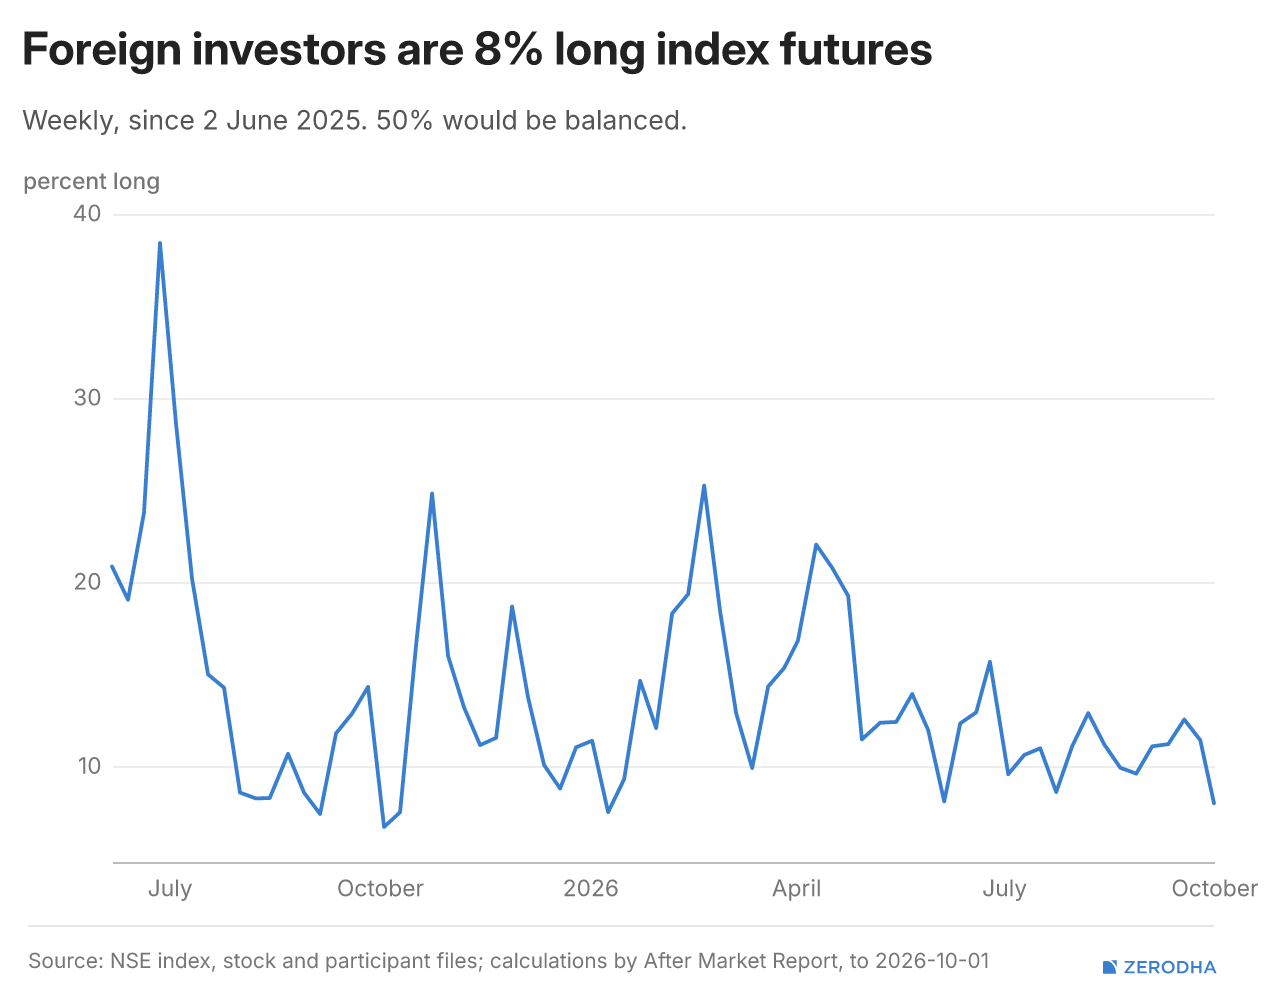
Institutional flows & positioning
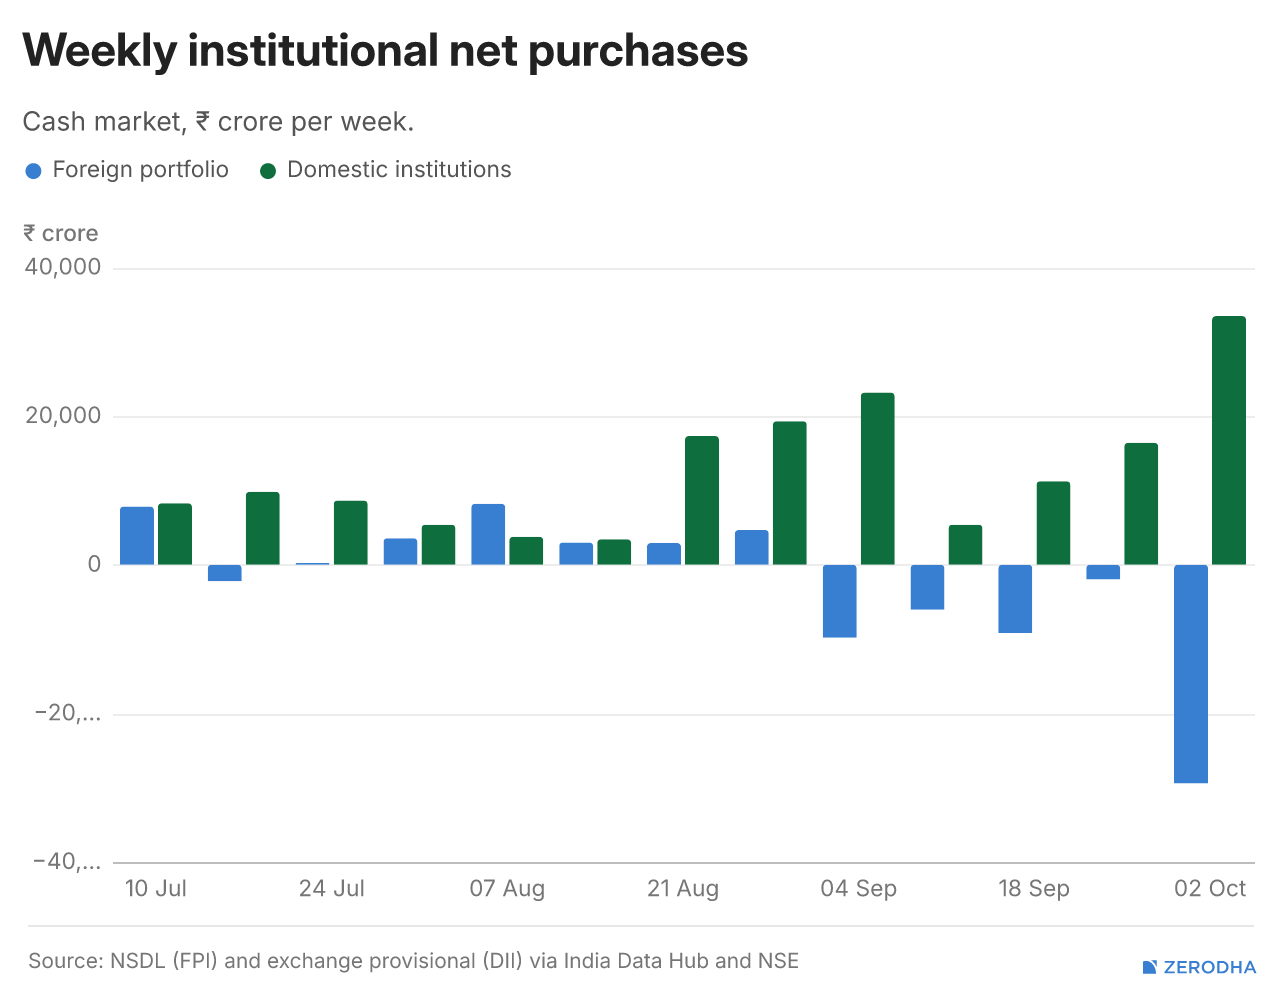
Domestic institutions continued to absorb foreign selling, buying a net ₹33,455 crore during the week against FII selling of ₹29,424 crore. The same divergence is visible over the past four weeks as well.
Week ahead
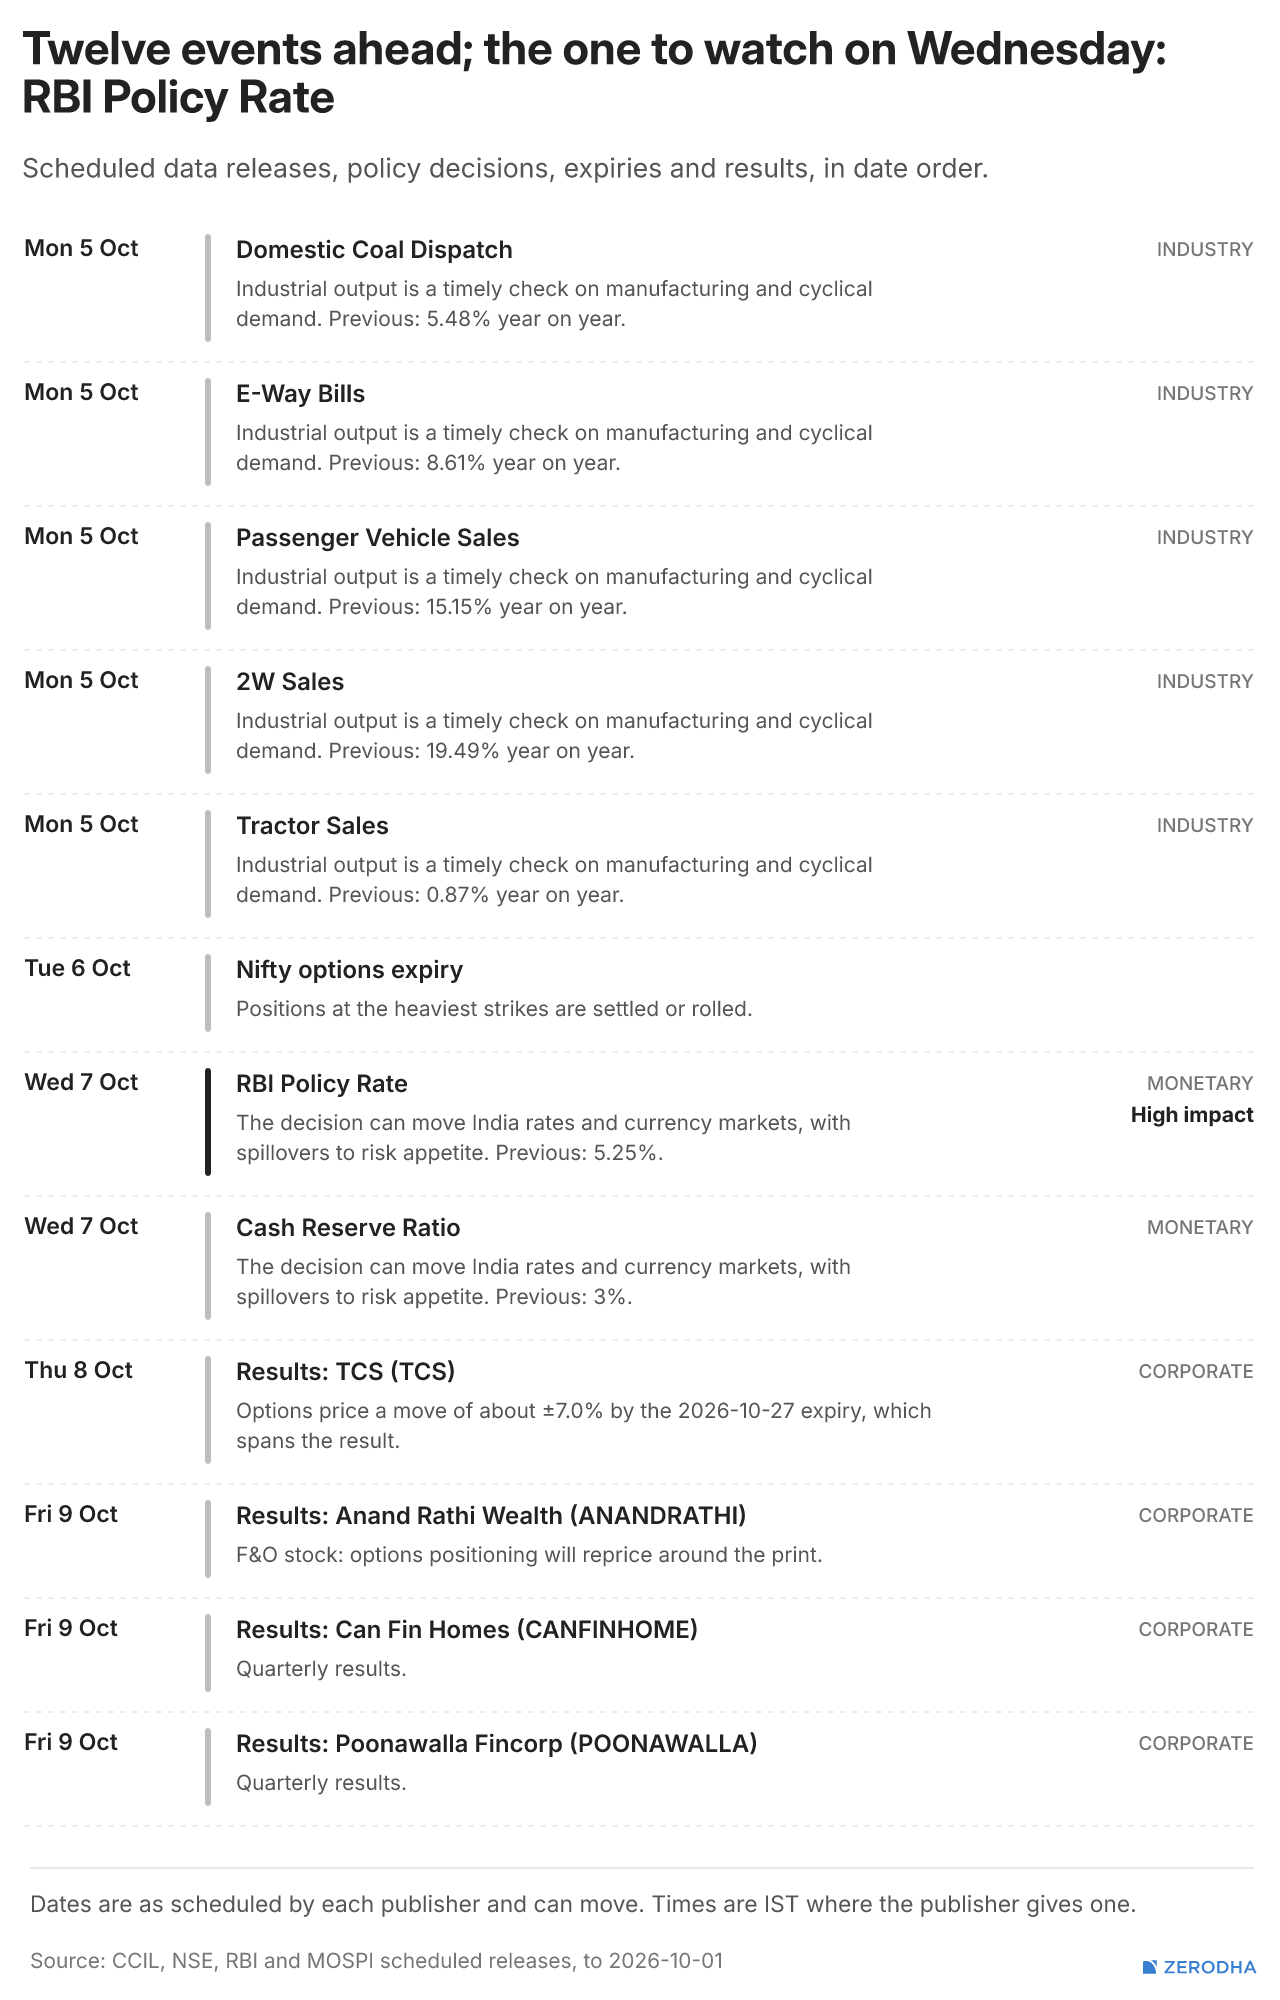
The coming week is packed with domestic data, the RBI policy decision and Nifty options expiry. Earnings season also begins to pick up, with TCS among the key results to watch.
Check out Weekly market metrics
Nifty fell 3% this week, extending its losing streak to eight consecutive weeks — its longest such run in 25 years. In the latest Weekly Market Metrics, we break down what drove the week, where the market stands now, and the key data and events to watch in the week ahead.
That’s it for this edition. We’d love to hear your feedback in the comments, and feel free to share this with your friends to spread the word!
Feedback on the base-rate panel, since you asked. Those 36 comparable weeks since April 2022 probably cluster into a handful of drawdowns, and adjacent weeks inside one selloff aren't independent. Showing how many distinct episodes they come from would tell readers whether 58% positive is a real tendency or two or three rebounds counted several times. I'd also like the DII versus FII divergence as a rolling series next to the streak.